
Fig. 9.
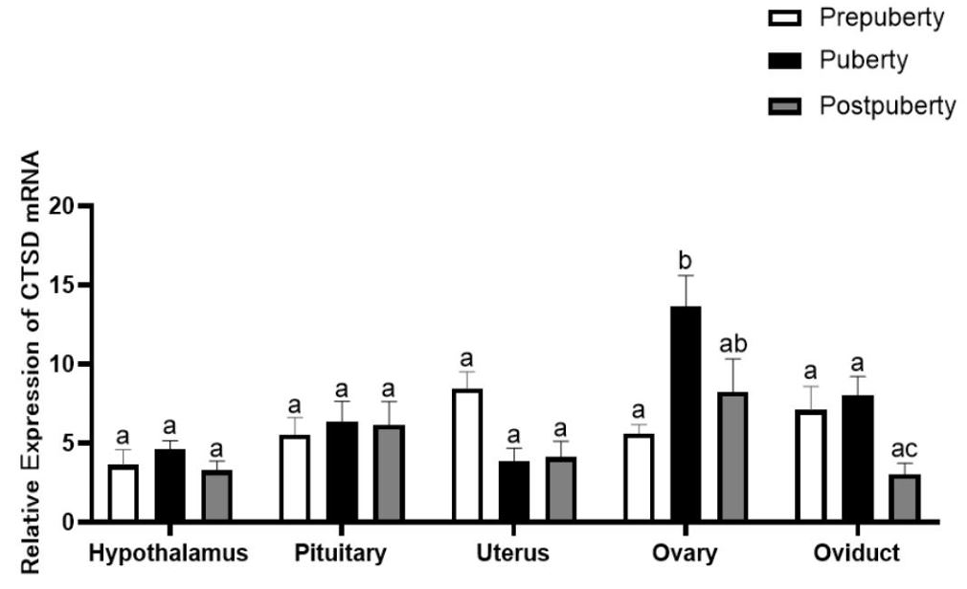
Relative expression levels of the CTSD gene in hypothalamus, pituitary, uterus ovary, and oviduct during three periods. Different letters above the bars in the same tissue indicate significant differences (P<0.05).
Relative expression levels of the CTSD gene in hypothalamus, pituitary, uterus ovary, and oviduct during three periods. Different letters above the bars in the same tissue indicate significant differences (P<0.05).