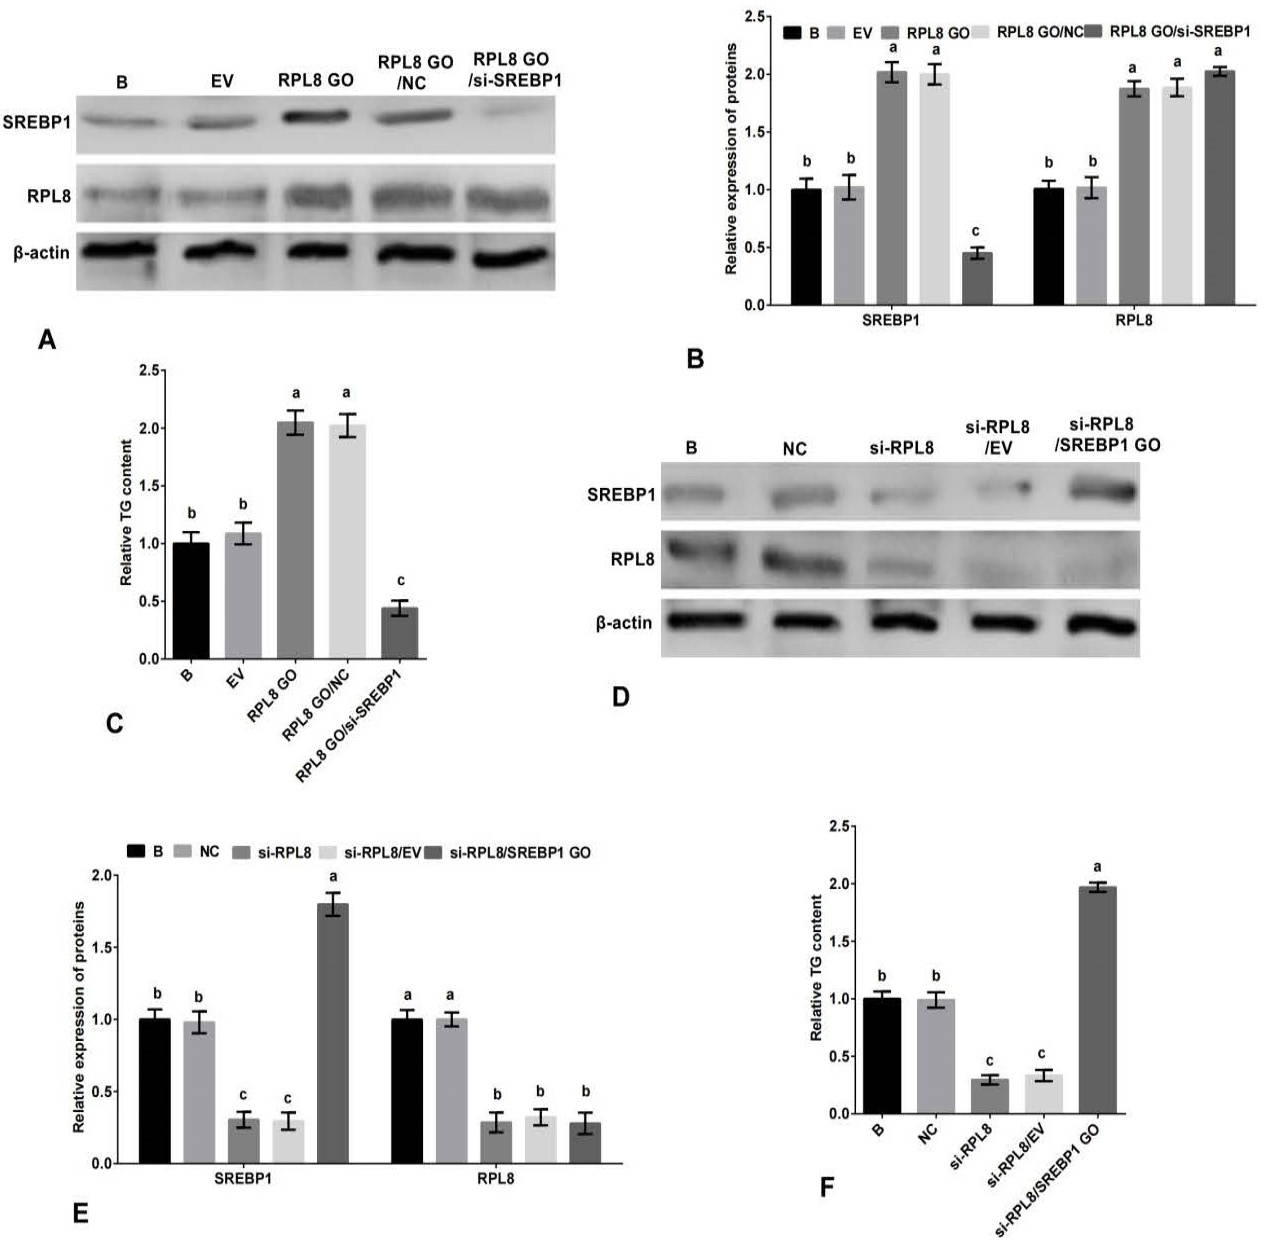
Promotion of milk fat synthesis by RPL8 through the SREBP1 pathway in YMECs. A-B The expression of RPL8 and SREBP1 in YMECs treated with RPL8 overexpression or RPL8 overexpression/SREBP1 silencing. C, The secretion of TG in YMECs treated with RPL8 overexpression or RPL8 overexpression/SREBP1 silencing. D-E, The expression of RPL8 and SREBP1 in YMECs treated with RPL8 silencing or RPL8 silencing/SREBP1 overexpression. F, the secretion of TG in YMECs treated with RPL8 silencing or RPL8 silencing/SREBP1 overexpression. In B and E, the expression of RPL8 and SREBP1 in “B” group was set to “1”. In C and F, the secretion of TG in “B” group was set to “1”. B: cells were no transfected. EV: cells were transfected with the empty vector. RPL8 GO: cells were transfected with RPL8 overexpression vector. NC: cells were transfected with the negative control siRNA. si-RPL8: cells were transfected with the RPL8 siRNA. RPL8 GO/ si-SREBP1: cells were co-transfected with the RPL8 overexpression vector and SREBP1 siRNA. In the bar charts, different superscript letters indicate significant differences (p<0.05), while the same letters represent no significant difference (p<0.05).