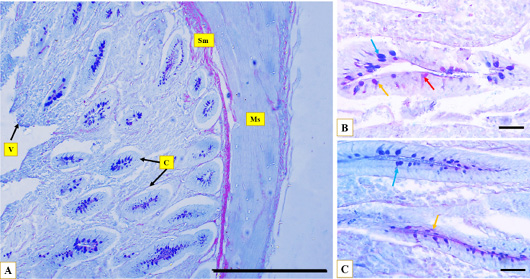
Figure 5:
Microphotographs show the glycoprotein distribution through the caecum, the muscular layer (Ms), the submucosa (Sm), caecal crypts (C), caecal villi (V), at middle portion (A), at the basal crypt (B) , and at the longitudinal crypt (C), acidic reaction (blue arrow) neutral reaction (red arrow), and mixed reaction (yellow arrow), AB/PAS stain, (A) Scale bar=200 µm, (B)(C) Scale bar=20 µm.
