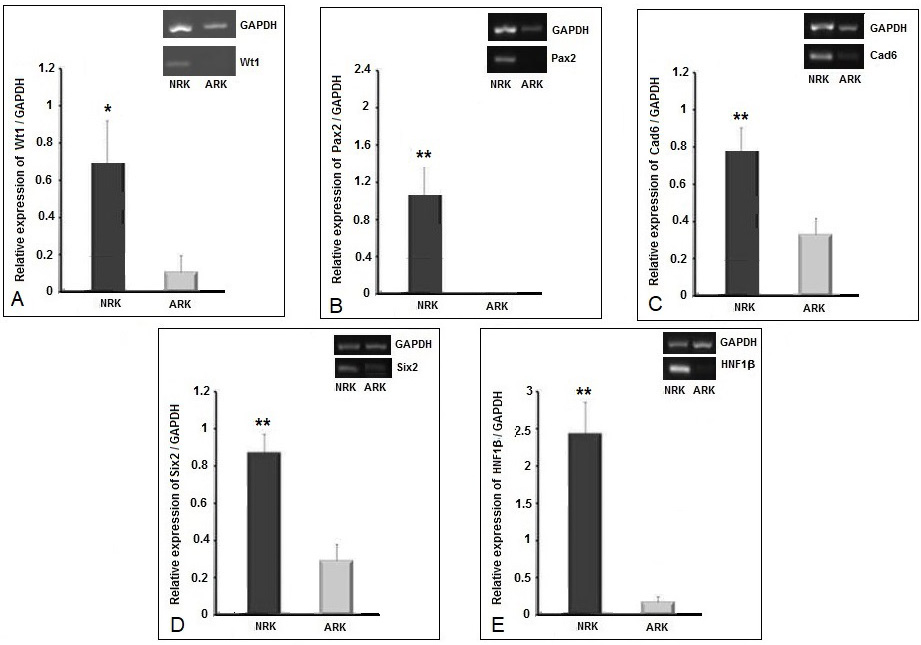
Fig. 1.
mRNA expression levels of kidney developmental genes in neonatal and adult rat kidney. One dimensional agarose gel image showing gene expression levels by RT-PCR for (A) Wt1, (B) Pax2, (C) Cad6, (D) Six2, and (E) HNF1β. Each gel image is accompanied by bar diagrams showing representative densitometry analyses of these genes. Y-axis shows the relative expression of each gene with respect to GAPDH expression. Data is presented as means ± standard error of means (SEM) where n = 3. For statistical analysis, a Shapiro-Wilk Normality Test was performed and all comparisons were made with Student’s t-test. 95 percent two-tailed confidence interval for differences of means was considered significant (p-value<0.05).