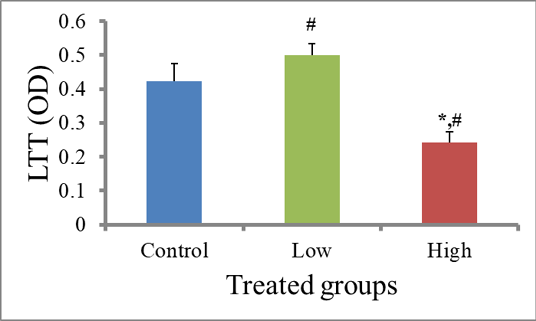
Figure 1:
Effect of dietary soy phytoestrogens on LTT (OD) in ovariectomized female albino rats. Data is expressed as mean ±SE. (*) denotes a statistical (p< 0.05) difference between the treated groups and the control. (#) denotes a statistical (p<0.05) difference between high and low dietary soy phytoestrogens concentrations. the p -value for the difference between the “High” group and the control group is p =0.04. p value for the difference between the “High” and “Low” dietary soy phytoestrogen concentrations is p =0.02.
