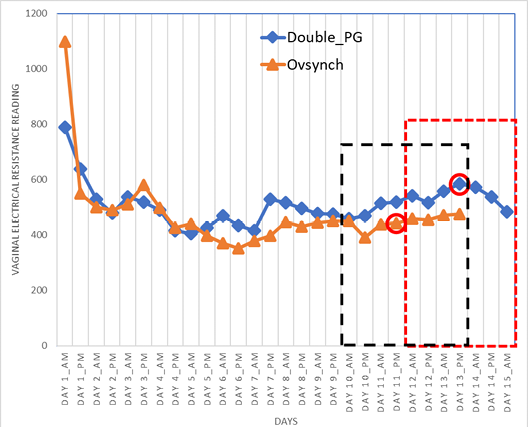
Figure 2:
Average vaginal electrical resistance reading for does in groups 2 and 3. The orange and blue arrows indicate the last hormonal treatment. The red and black dotted boxes show the duration of the estrus periods post the last hormonal treatment. The chart showed that at the beginning of the experiment, the does were at different stages of the oestrous cycle. The VER post-hormonal treatment chart is however indicated in the dotted box (red for group 2 and black for group 3). The red rings indicate the likely time of ovulation after the completion of the hormonal treatment.