
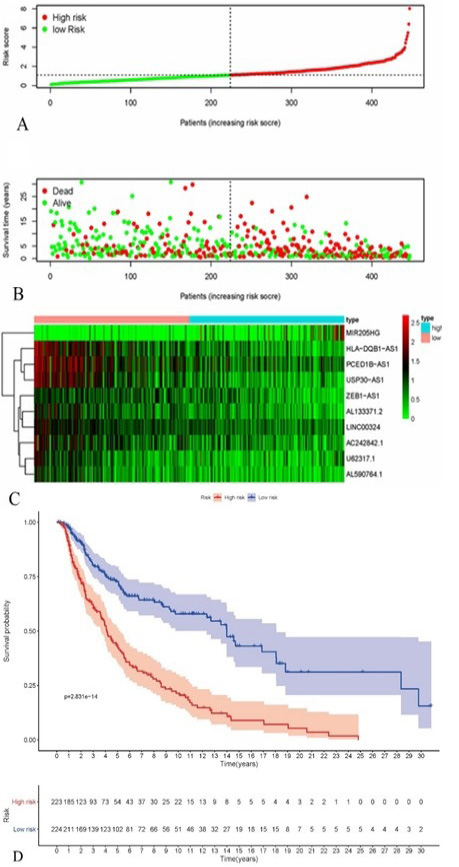
Fig. 2.
Construction and validation of the 10 survival-related immune lncRNAs signature for survival prediction. (A) The risk score of each patient. (B) The scatter plot of the sample survival overview, the green and red dots respectively represent survival and death. (C) The heatmap showed the 10 differentially expressed lncRNAs. (D) Kaplan-Meier plot for overall survival (OS) based on risk score of the 4 gene-based signatures of patients with primary SKCM in the TCGA cohort.