View larger version:
Download Original File
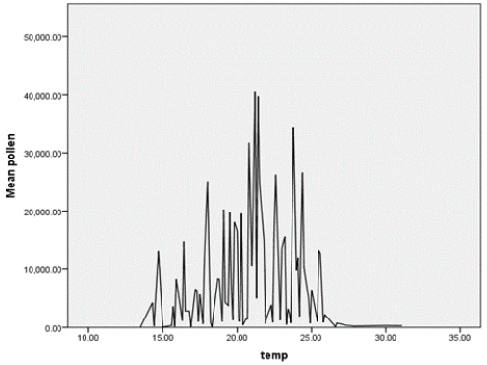
Figure 10:
Graphical representation of three years spring mean pollen count of and average temp.
