Figure 3:
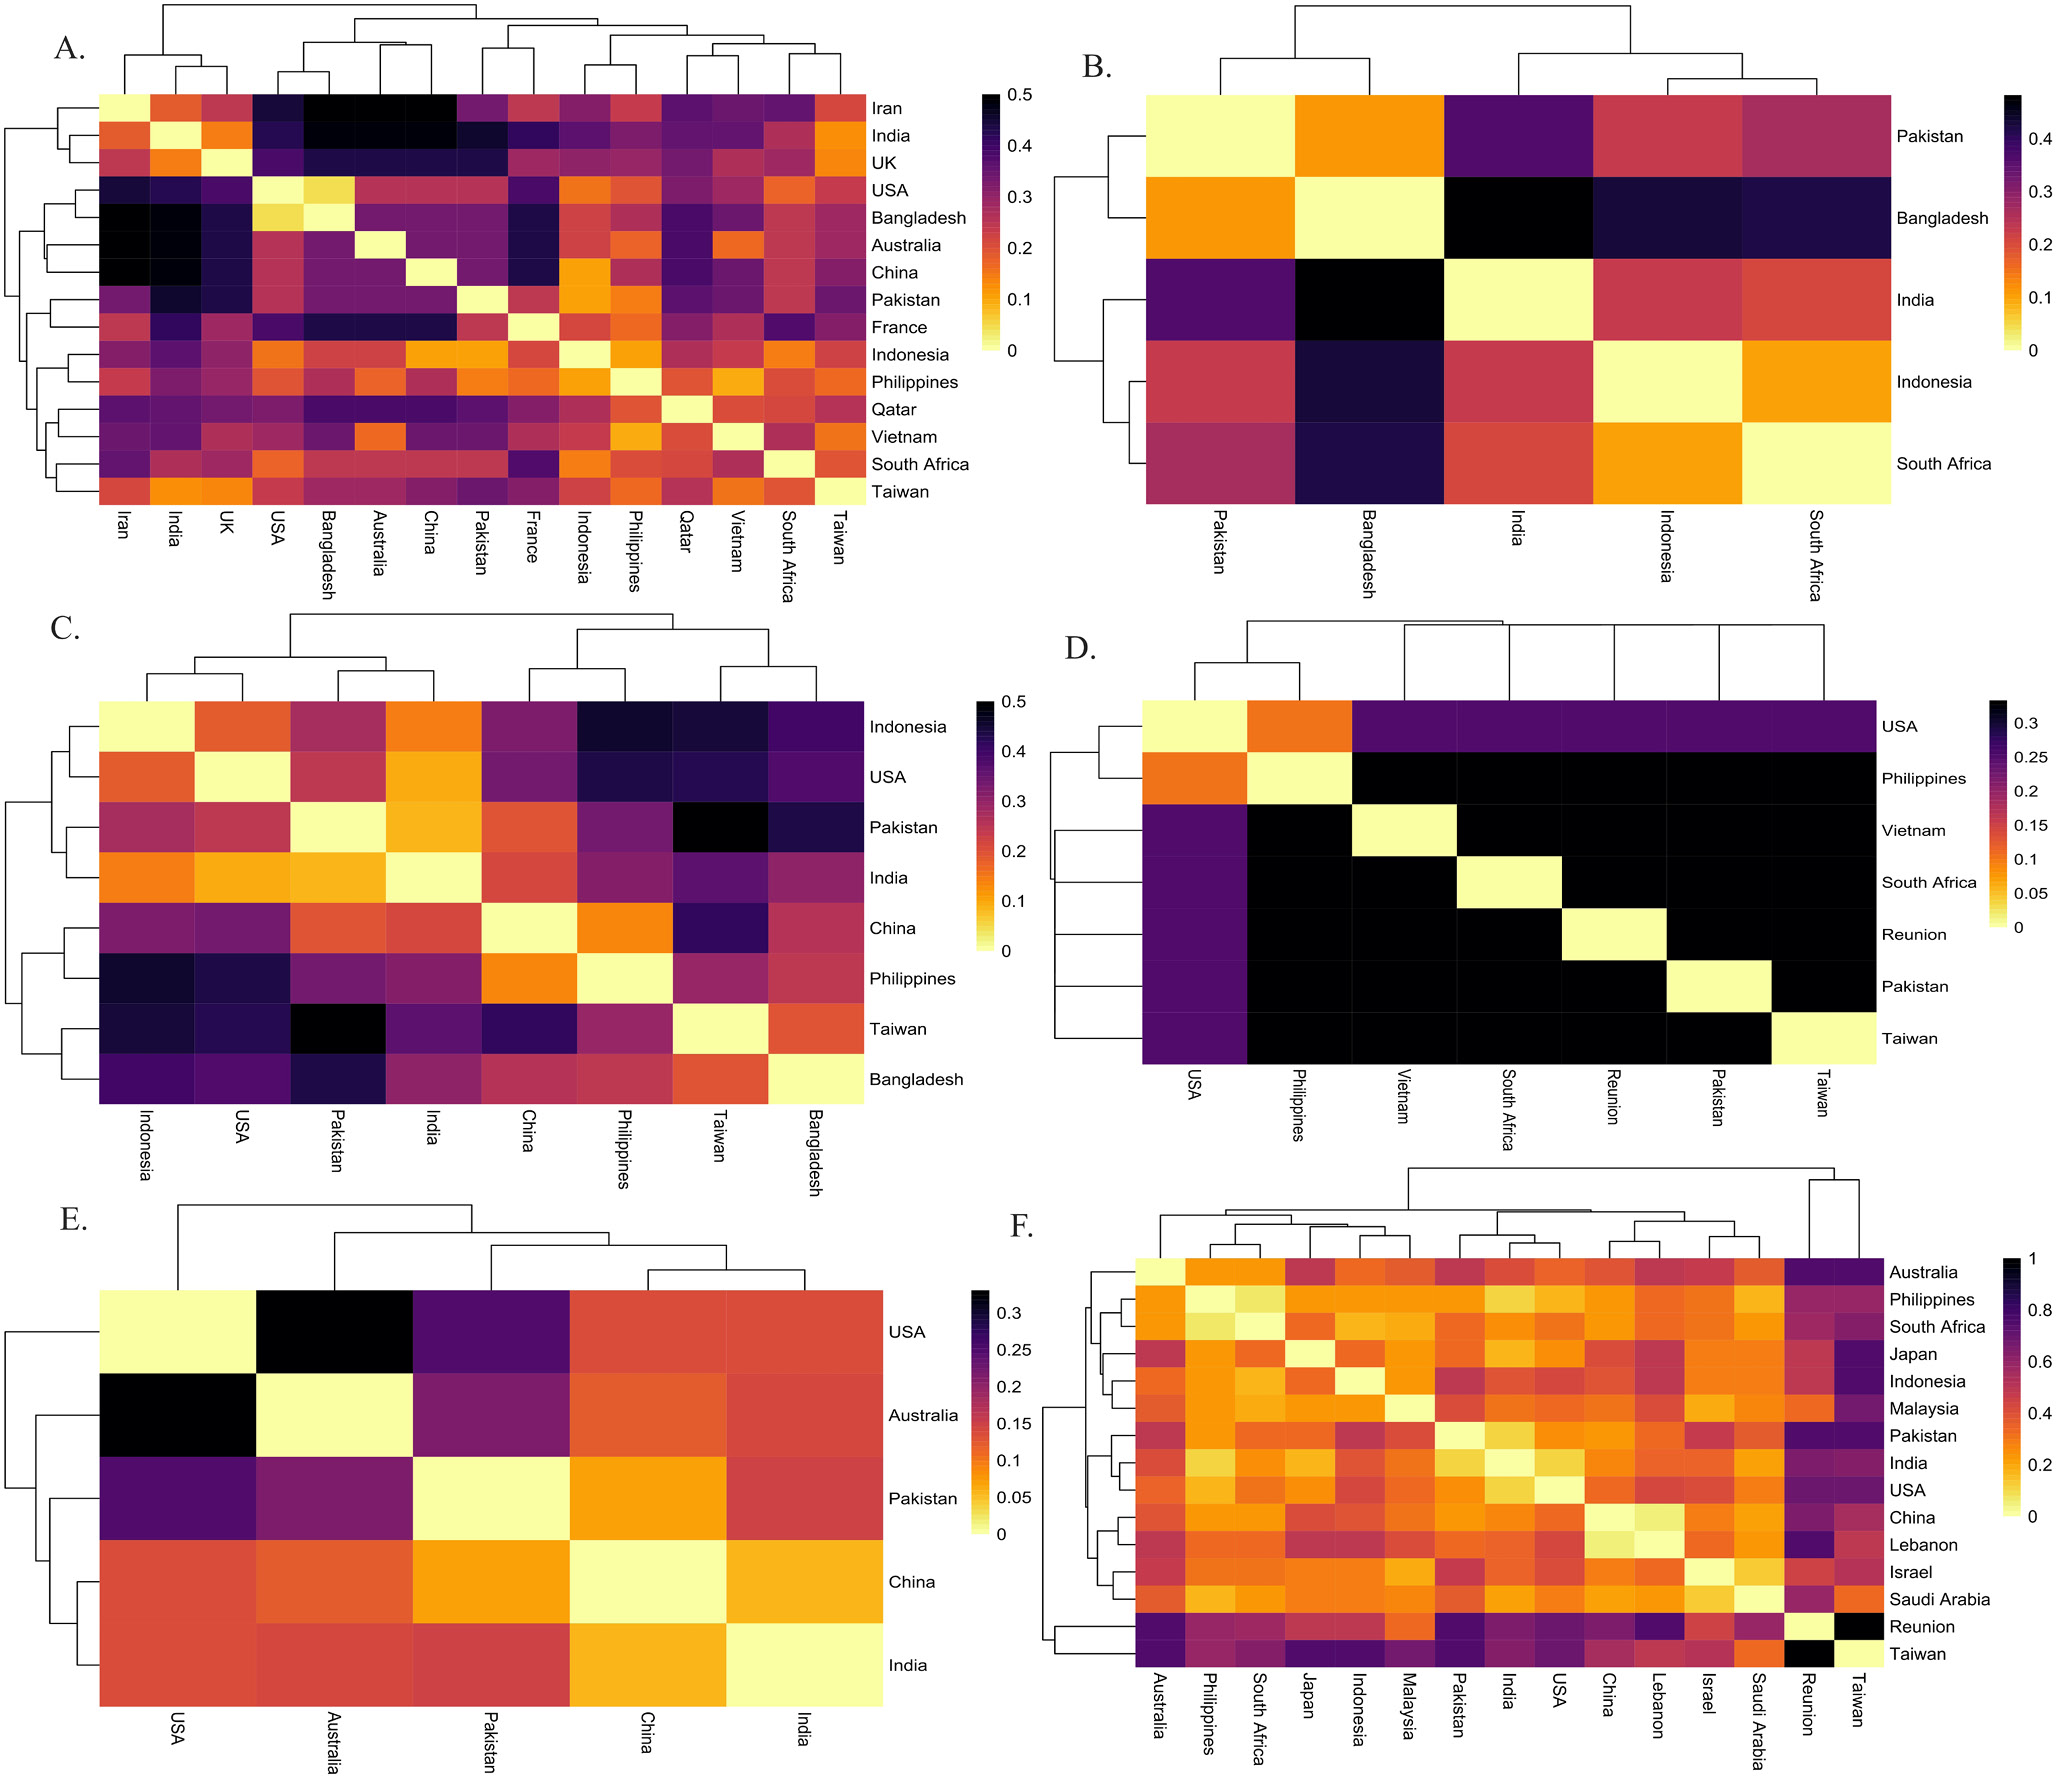
Heatmap illustration of Fst values (A). Chanos chanos (B). Drepane longimana (C). Lactarius lactarius (D). Myripristis botche (E). Pampus argenteus (F). Plotosus lineatus Heatmap chart is based on Fst analysis of sequence data of species population. The darker color shows high values and the light color shows fewer values from Fst.