
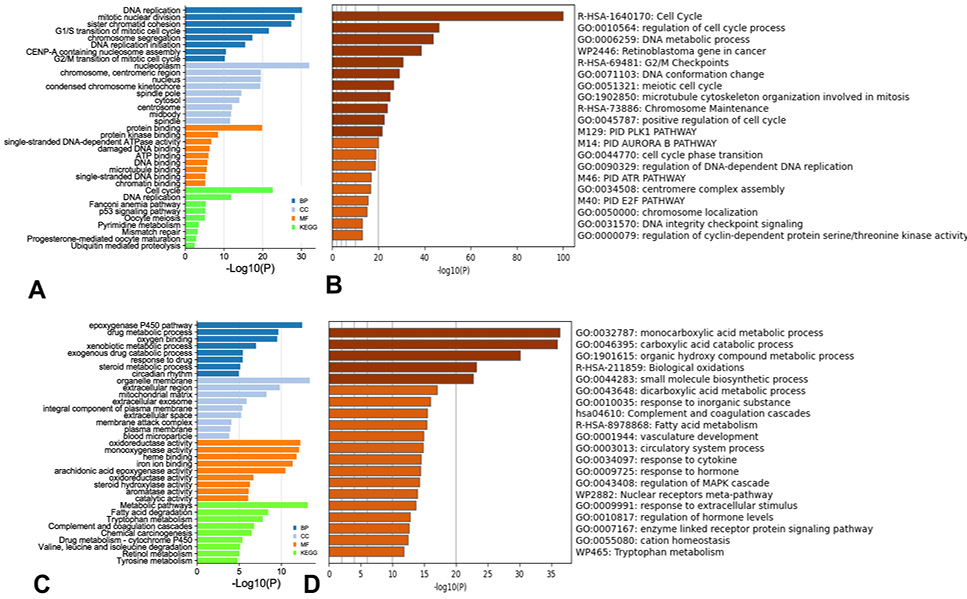
Fig. 2.
Enrichment analysis of the DEG in HCC. Bar plot of GO (BP, CC, MF) and KEGG enriched items of up-regulated genes analyzed by DAVID 6.8 (A) and Metascape (B). Bar plot of GO (BP, CC, MF) and KEGG enriched items of down-regulated genes analyzed by DAVID 6.8 (C) and Metascape (D).