View larger version:
Download Original File
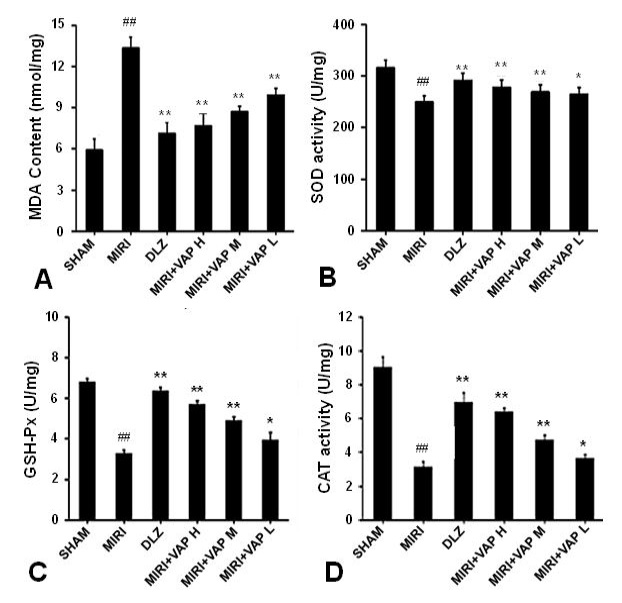
Fig. 3.
MDA (A), SOD (B), GSH-Px (C) and CAT (D) activities in myocardial tissue.
Note: Compared with the control group, # p<0.05, ## p<0.01; Compared with MIRI group,* p<0.05, ** p<0.01.
