
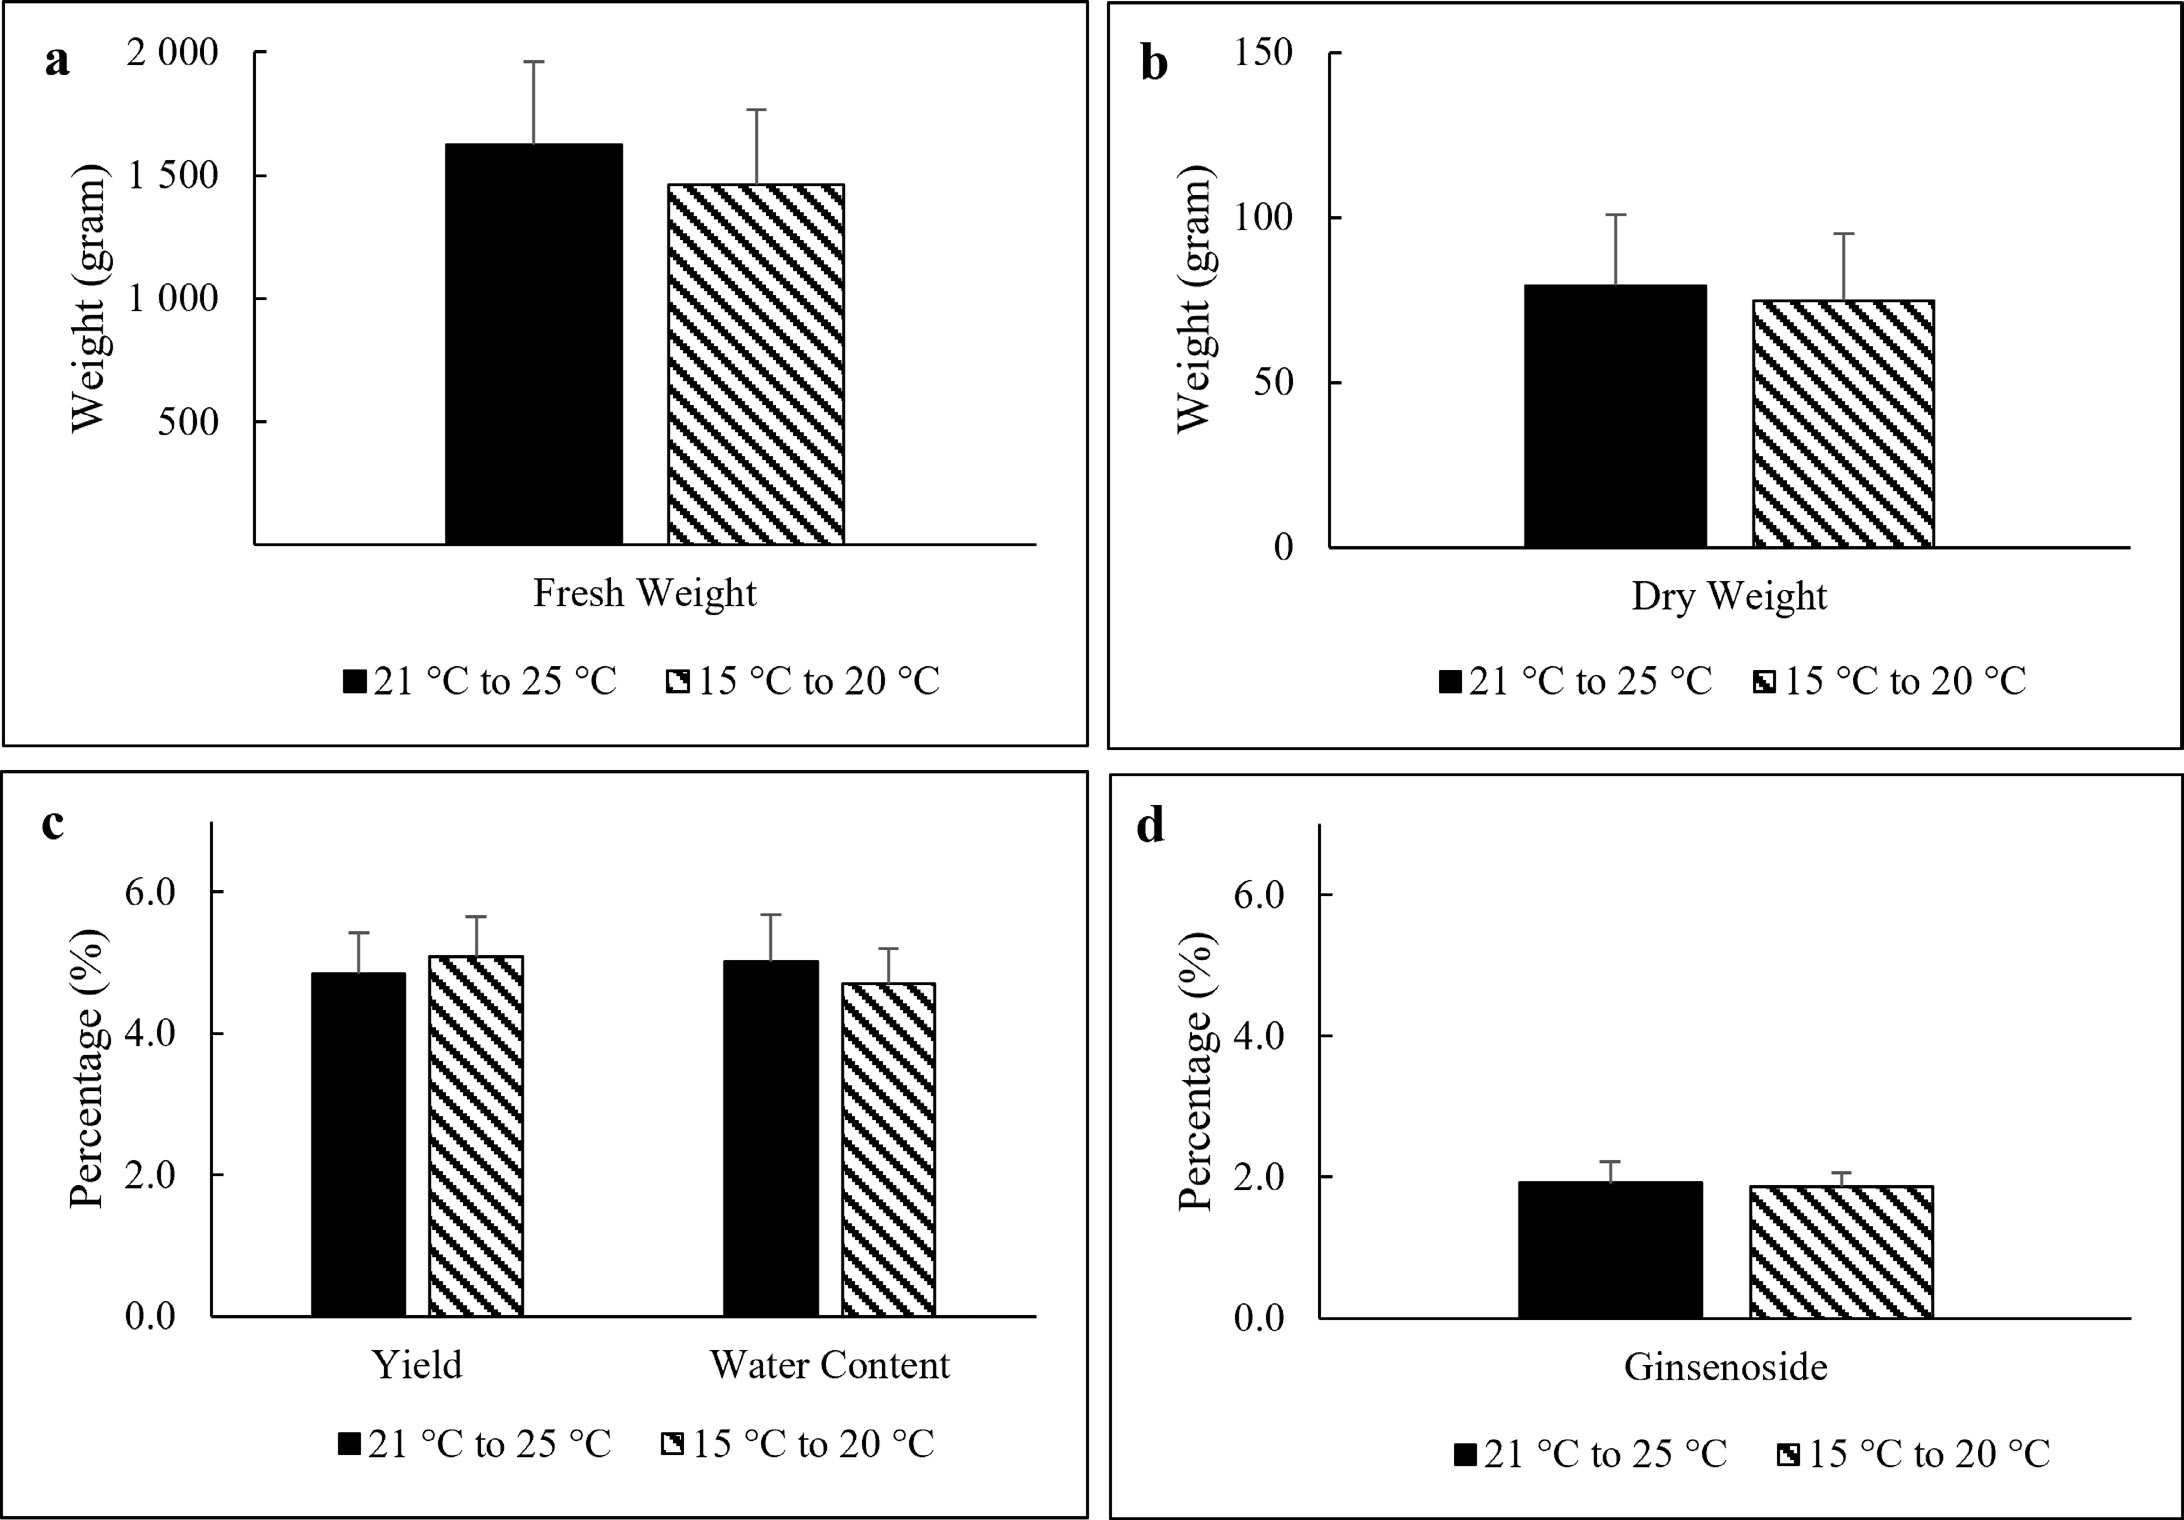
Figure 4:
Bar chart of the effect of incubation temperature on a) fresh weight, b) dry weight, c) yield percentage and water content, and d) ginsenoside content. Values are means ± SD (n > 3). Based on the One-Way ANOVA, the parameters showed no significantly different values for each variation (P < 0.05 %).