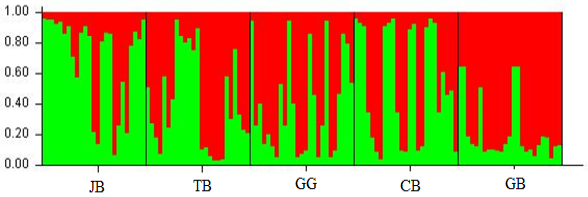
Fig. 2.
Genetic structuring patterns among populations of H. molitrix as revealed by structure analysis. The two distinct colors of the column represent the estimated possibility of belonging to two populations, and each vertical column represents one individual. Distinct colors in the same individual indicate the %age of the genome shared with each cluster.