View larger version:
Download Original File
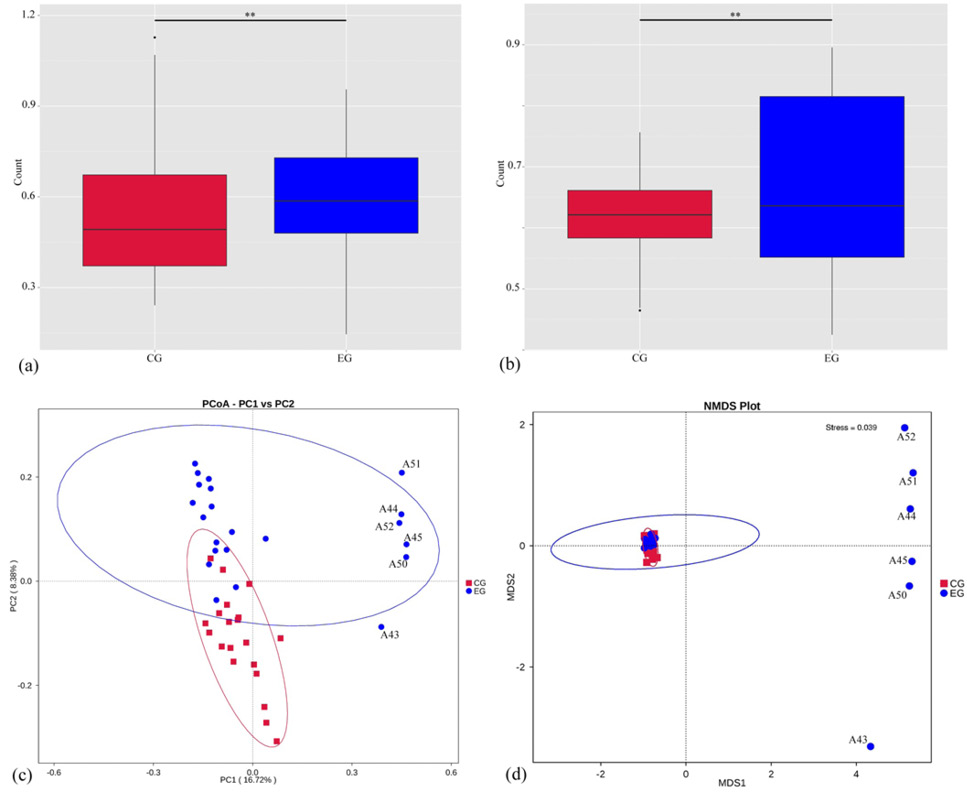
Fig. 3.
Beta diversity based on weighted (a) and unweighted (b) unifrac, PCoA plotting (c) and NMDS plotting (d) in this study. Scatters with numbers in (c) and (d) denote divergent samples in group EG. Significance P < 0.01.
