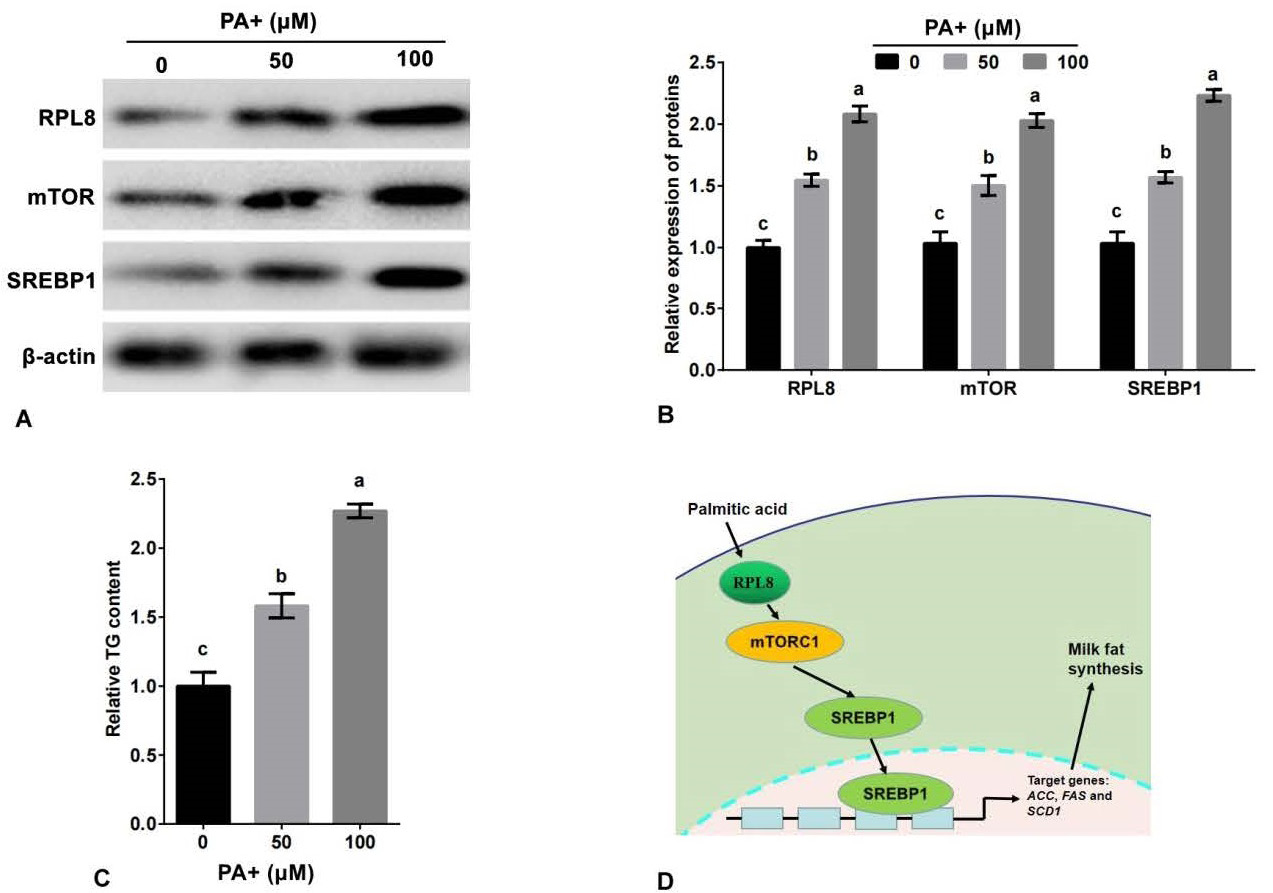
Palmitic acid promotes the expression of RPL8 and secretion of TG in YMECs. The expression of RPL8, mTOR, and SREBP1 in cells treated with 0, 50, and 100 μM of PA is shown in A-B, while C displays the secretion of TG in cells treated with the same concentrations of PA. D Shows a schematic model of how RPL8 promotes milk fat synthesis via the mTORC1-SREBP1 pathway in YMECs. In B, the expression of RPL8, mTOR, and SREBP1 in cells treated with 0 μM of PA was set to “1”. In C, the secretion of TG in cells treated with 0 μM of PA was set to “1”. PA refers to palmitic acid. The bar charts display superscript lowercase letters indicating significant differences (p<0.05) between different experimental groups, while identical letters indicate no significant difference (p>0.05).