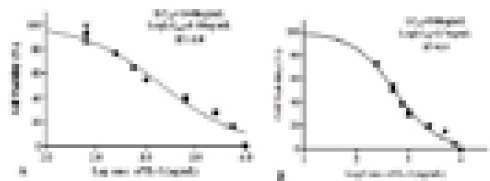
Fig. 6.
MTT assay results showing. A, viability (%) of HepG2 cell lines after treatment with varying concentrations of IL-2 (250ng-10,000ng) for 48 h. B, viability (%) of MCF-7 cell lines after treatment with varying concentrations of IL-2 (250ng-10,000ng) for 48 h.