View larger version:
Download Original File
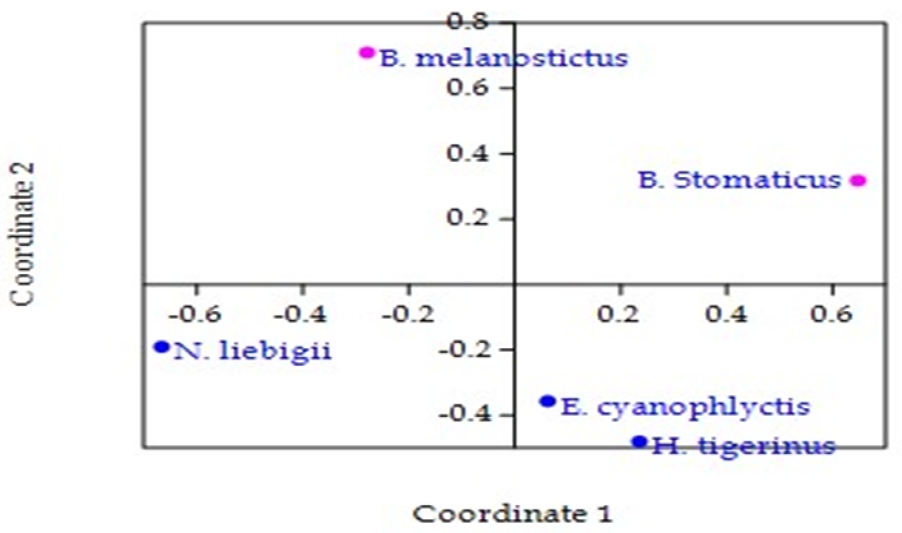
Figure 3:
PCoA graph showed the variation among anurans on the basis of morphometric data.