View larger version:
Download Original File
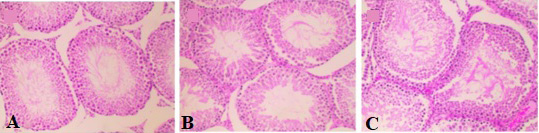
Fig. 2.
The histological structure of control group (A), low dose group (B), and high dose group (C).