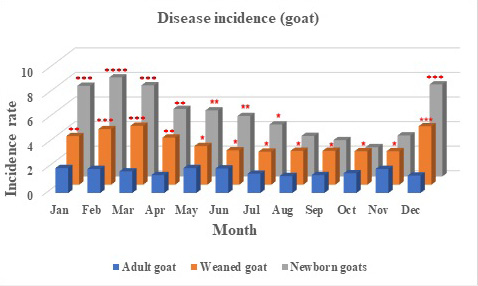
Figure 6
The disease incidence in adult, weaned, and newborn goats throughout the year (January-December). Statistical analysis shows the significant differences between the treatments as indicated by asterisks.
The disease incidence in adult, weaned, and newborn goats throughout the year (January-December). Statistical analysis shows the significant differences between the treatments as indicated by asterisks.