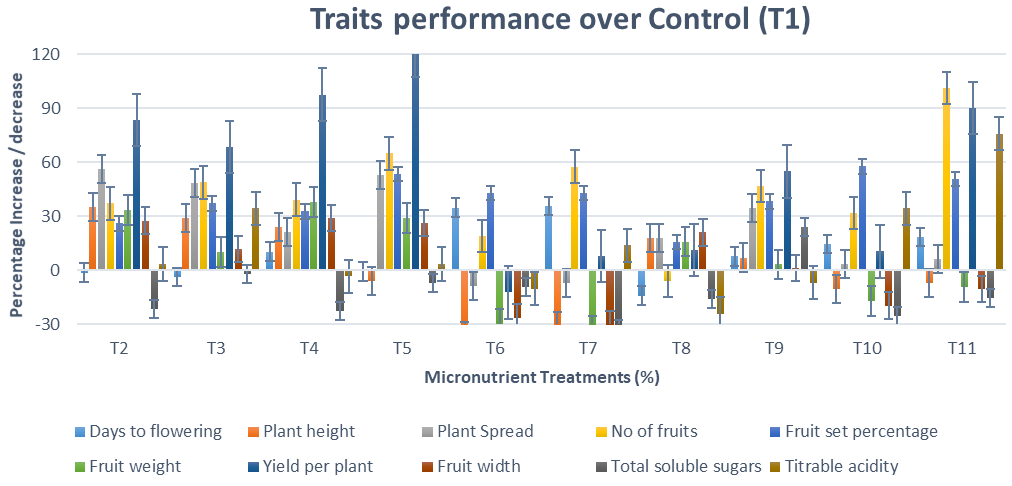
Figure 1:
Performance of strawberry traits over control (T1) treatment. X-axis represent micronutrient treatment (%). Y-axis represents improvement or decline in the performance of a trait with respect to control (T1) in response to the applied treatments (T2-211).