
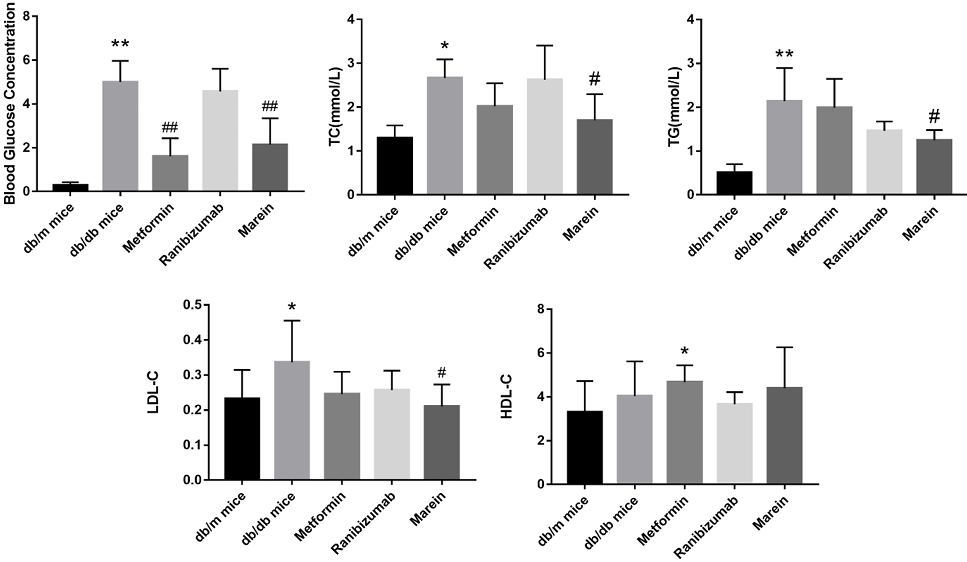
Fig. 1.
Effect of marein on serum TG, TC, LDL, HDL and BGC in db/db mice.
Note: The values were expressed as `x ± SEM, n ≥ 6, *P < 0.05, **P < 0.01 indicated statistical significance compared with the control group. #P < 0.05, ##P < 0.01 indicated statistical significance compared with the model group.