View larger version:
Download Original File
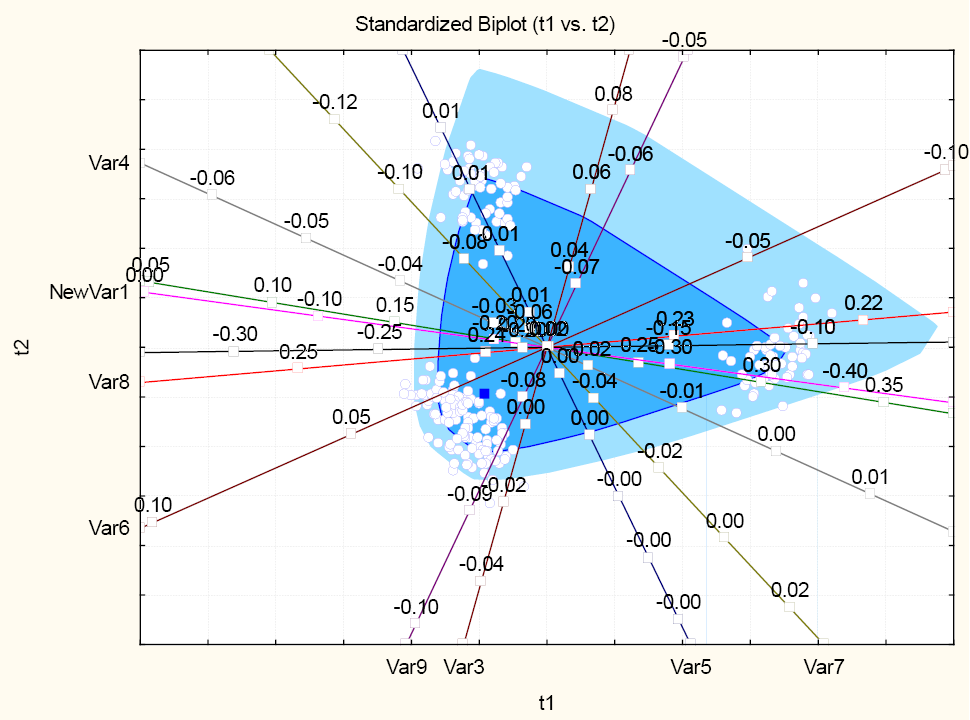
Fig. 6.
Standardized biplot of the discriminant function analysis.