
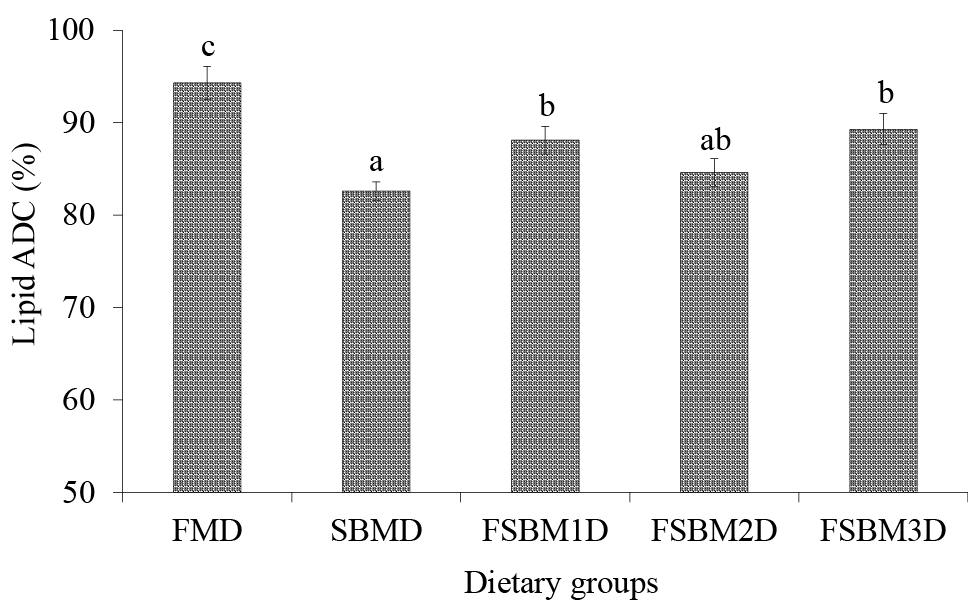
Fig. 3.
Lipid ADC of pompano fed the experimental diets. Values are presented as the mean±standard deviation of three replicates. Bars with different superscripts are significantly different (P < 0.05).
Lipid ADC of pompano fed the experimental diets. Values are presented as the mean±standard deviation of three replicates. Bars with different superscripts are significantly different (P < 0.05).