
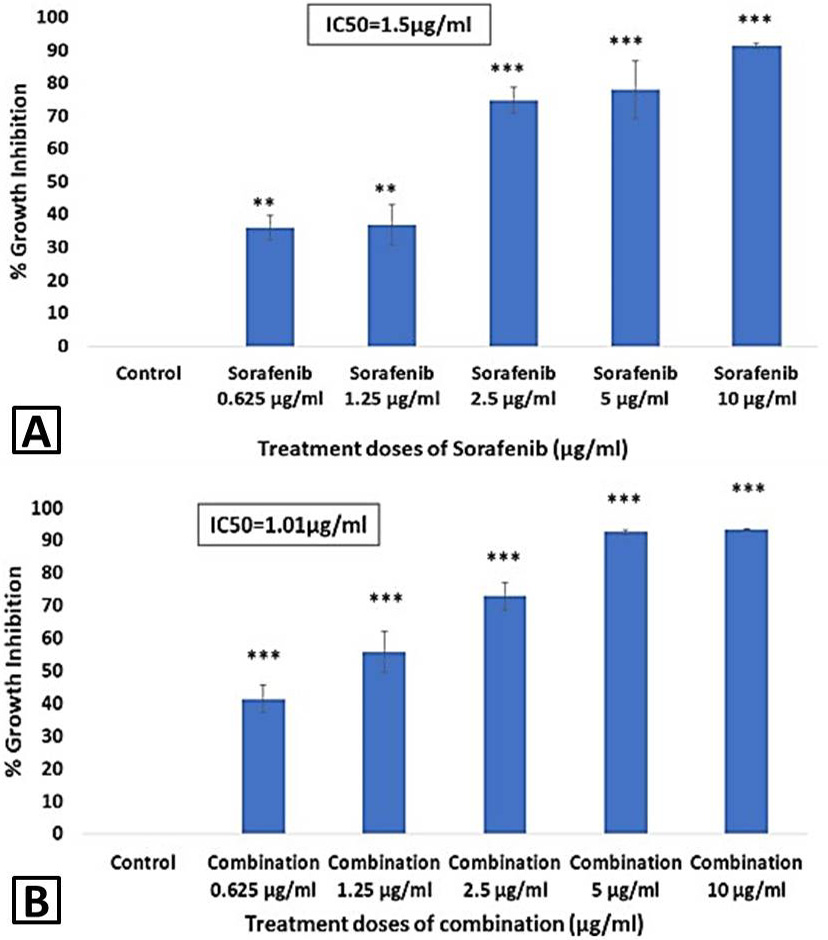
Fig. 1.
Cytotoxic effects of Sorafenib and combination on HepG2 cells following 48 h of treatment. A, the graph shows dose dependent inhibitory effect of Sorafenib on growth of HepG2 cells. Significant difference between untreated and Sorafenib treated cells was observed and is indicated as **P<0.01 at 0.625µg/ml and 1.25µg/ml, and ***P<0.001 at higher doses. B, bar graph shows dose dependent effect of combination on growth inhibition of HepG2 cells with level of significance ***P<0.001 versus untreated group. Each bar represents mean ± SEM for the experiments run in triplicates.