
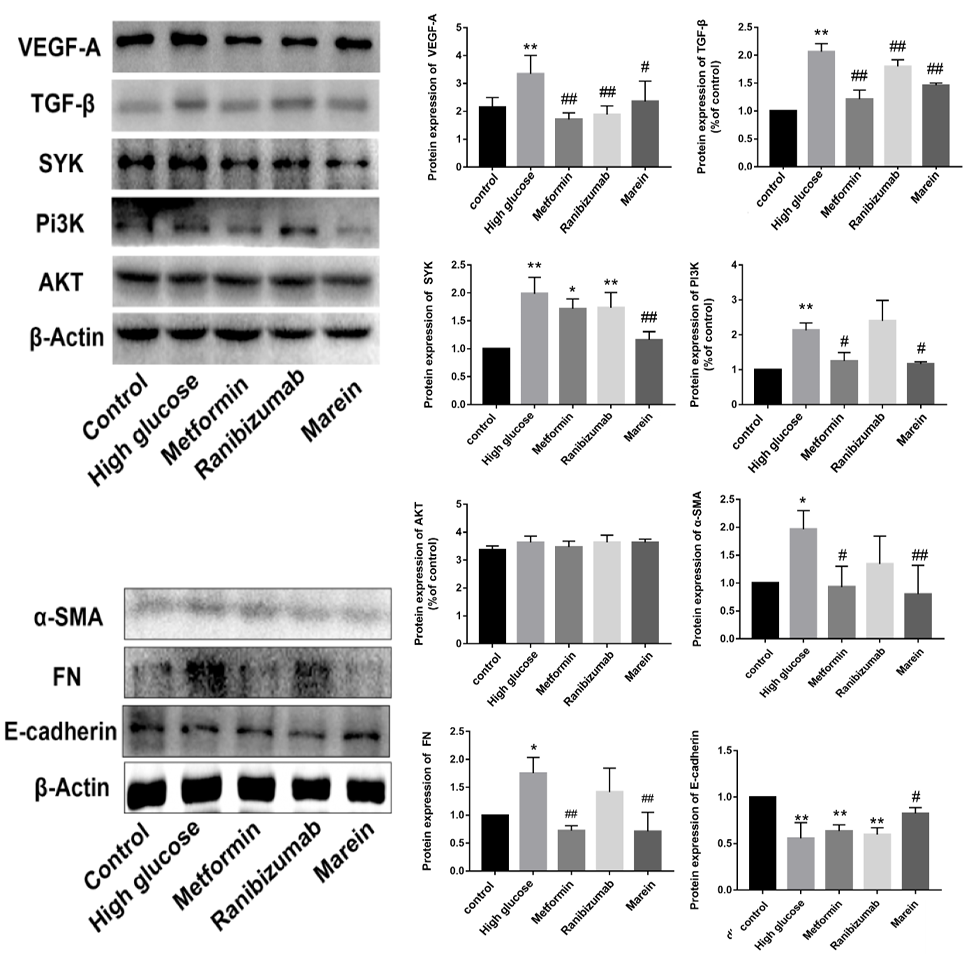
Fig. 6.
Effect of marein on protein expression in ARPE-19 cells treated with high glucose. Note: *P < 0.05, **P < 0.01 indicated statistical significance compared with the control group. #P < 0.05, ##P < 0.01 indicated statistical significance compared with the model group.