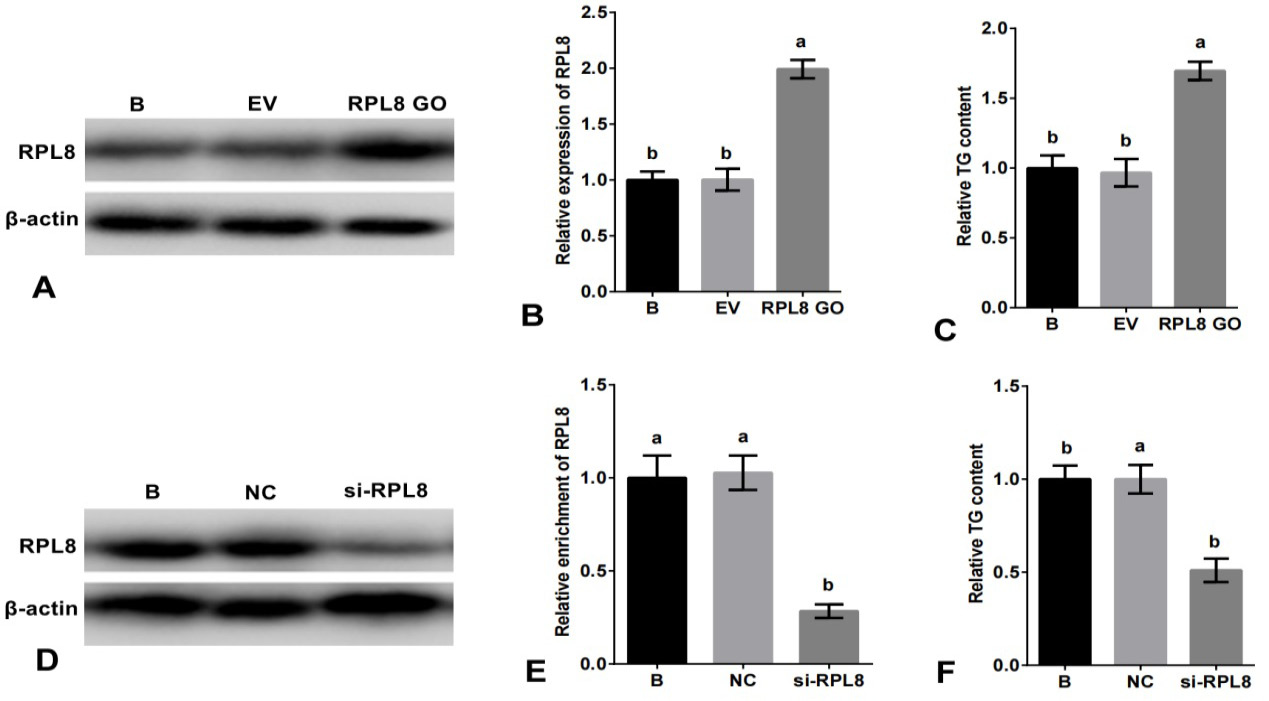
Role of RPL8 in promoting milk fat synthesis in YMECs. In A-B, the expression of RPL8 was increased in YMECs subjected to RPL8 over-expression. Similarly, C shows increased TG secretion following RPL8 over-expression in YMECs. On the other hand, D-E demonstrates a decrease in RPL8 expression in YMECs treated with RPL8 silencing. Furthermore, F depicts a decrease in TG secretion in YMECs subjected to RPL8 silencing. In B and E, the expression of RPL8 in the “B” group was set to “1”, while in C and F, the secretion of TG in the “B” group was also set to “1”. Cells were divided into different groups, including those that were not transfected B, those that were transfected with the empty vector (EV), those that were transfected with the RPL8 over-expression vector (RPL8 GO), those that were transfected with the negative control siRNA (NC), and those that were transfected with the RPL8 siRNA (Si-RPL8). In the bar charts, different superscript letters indicate significant differences (p<0.05), while the same letters indicate no significant difference (p>0.05).