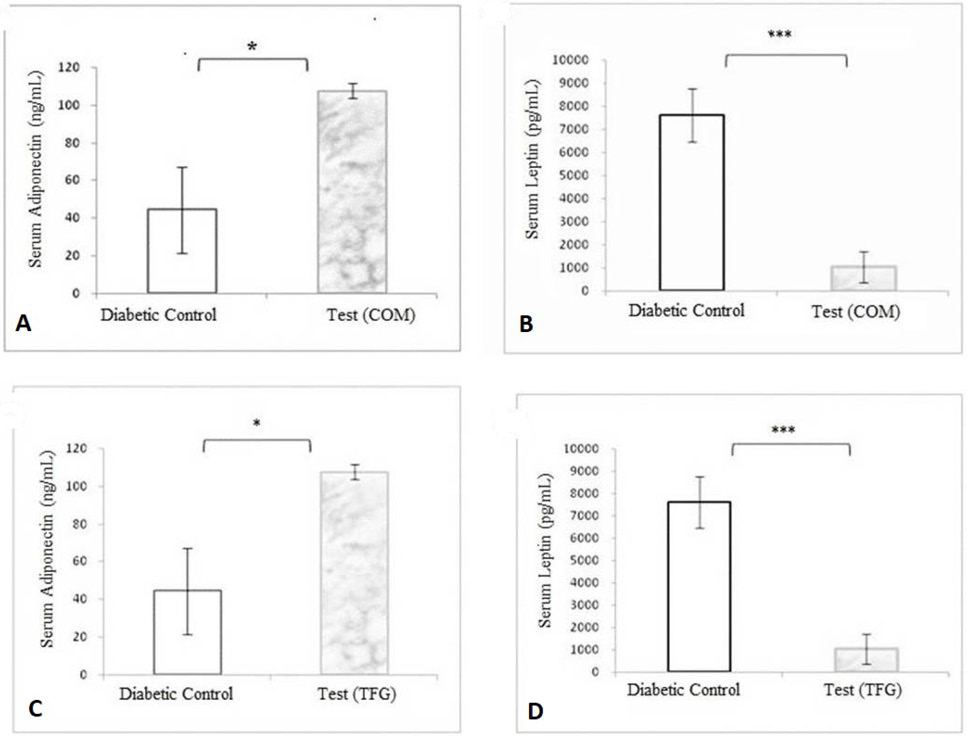
Fig. 7.
Quantification of adipokines after herbal combination extract treatment using ELISA: (A) Adiponectin, (B) Leptin and Quantification of Adipokines after Trigonella foenum graceum treatment, (C) Adiponectin, (D) Leptin. Data is presented as means ± SEM where n = 3. For statistical analysis, a Shapiro-Wilk Normality test was performed and all comparisons were made with Student’s t- tests. Level of confidence was p <0.05; (*= p<0.05, **=p<0.01, ***= p<0.001).
