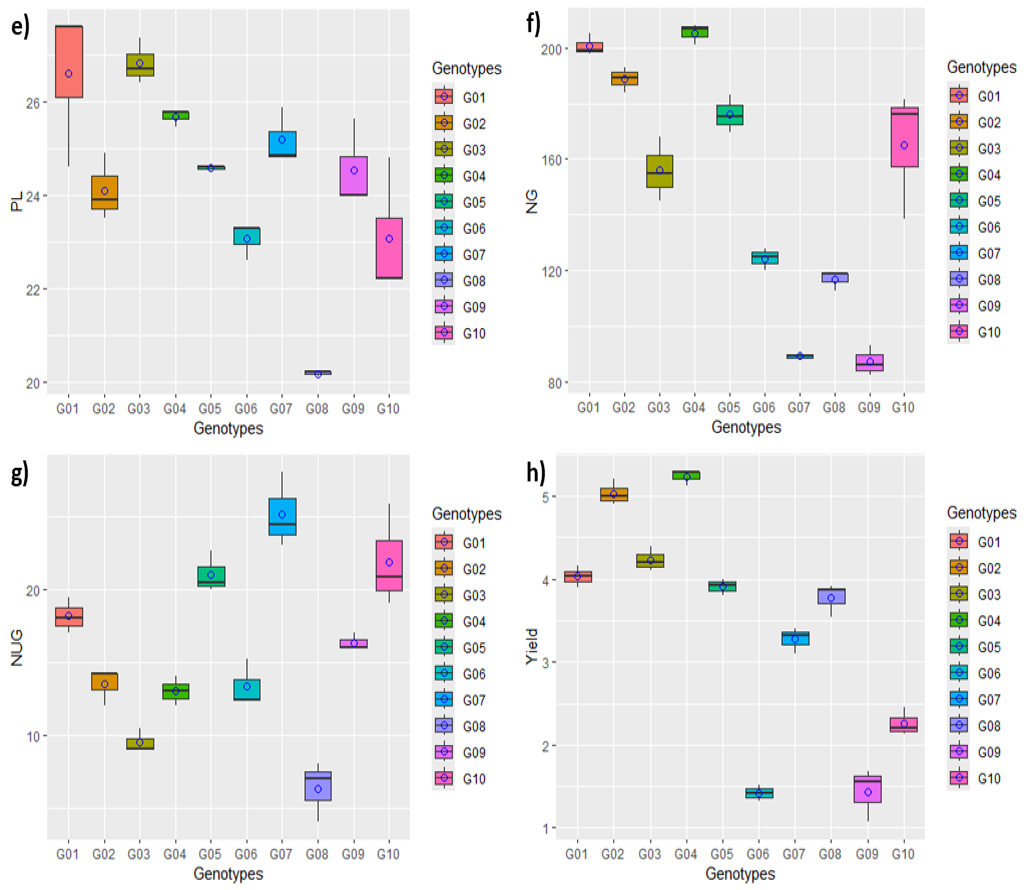
Figure 2:
Boxplots illustrating the distribution of (e) Length of panicle, (f) No. of grains per hill, (g) No. of unfilled grains per hill, (h) yield values. The blue points are mean values, and the horizontal lines dividing the box represent the medians. The lower and upper box boundaries, as well as the lower and higher whiskers, reflect the Q1 (25th percentile), Q3 (75th percentile) and Interquartile Range expressing middle 50% scores. Note: G1 (BRRI dhan34), G2 (BRRI dhan52), G3 (BRRI dhan100), G4 (Binadhan-10), G5 (Swarna), G6 (Tulshimala), G7 (Rajashail), G8 (Birui), G9 (Hail dhan), G10 (Lal paika).
