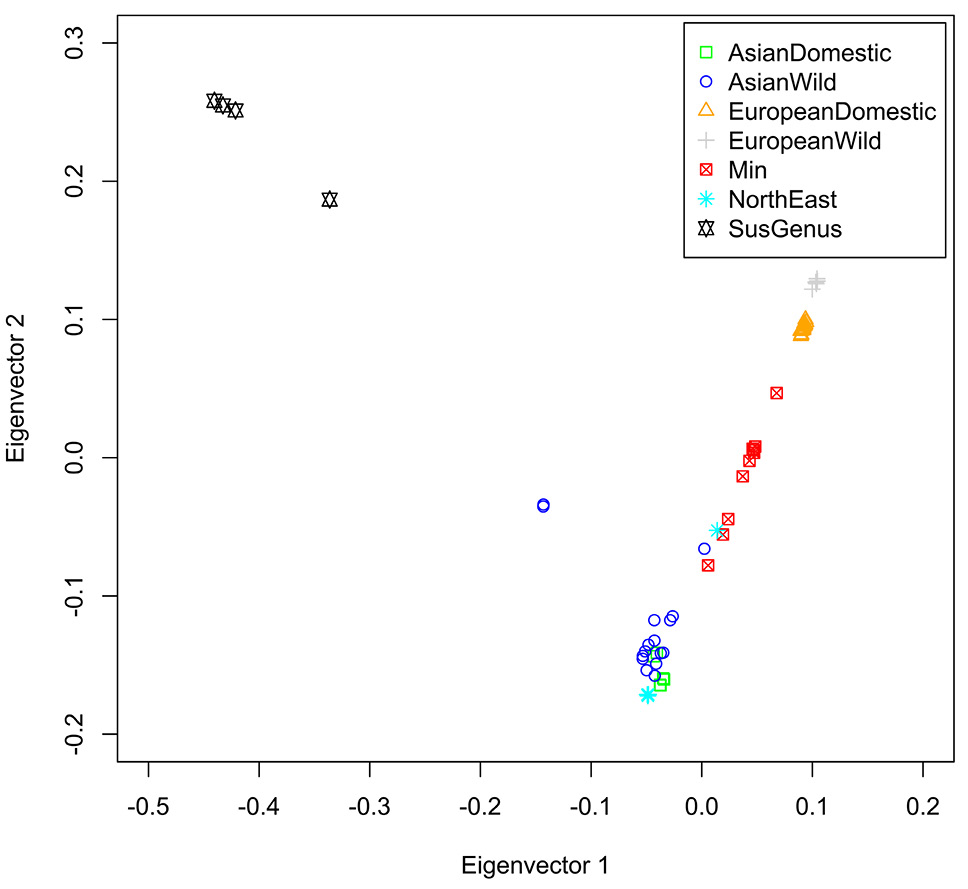
Fig. 3.
Principal component analysis (PCA). Each point represents an individual, and 80 individuals were divided into seven pig populations. Different populations are represented by different colors and shapes. Green represents Asian domestic pigs, blue represents Asian wild boars, yellow represents European domestic pigs, gray represents European wild boars, red represents Min pig, wathet blue represents Northeast wild boars, and black represents the domestic pig’s close relatives.