View larger version:
Download Original File
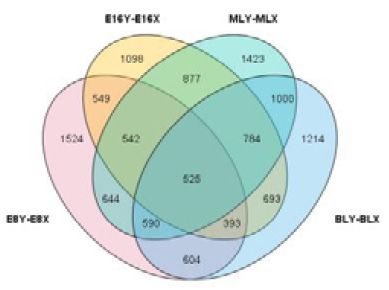
Fig. 3.
Venn diagram of the DEGs of the four comparison groups.
