
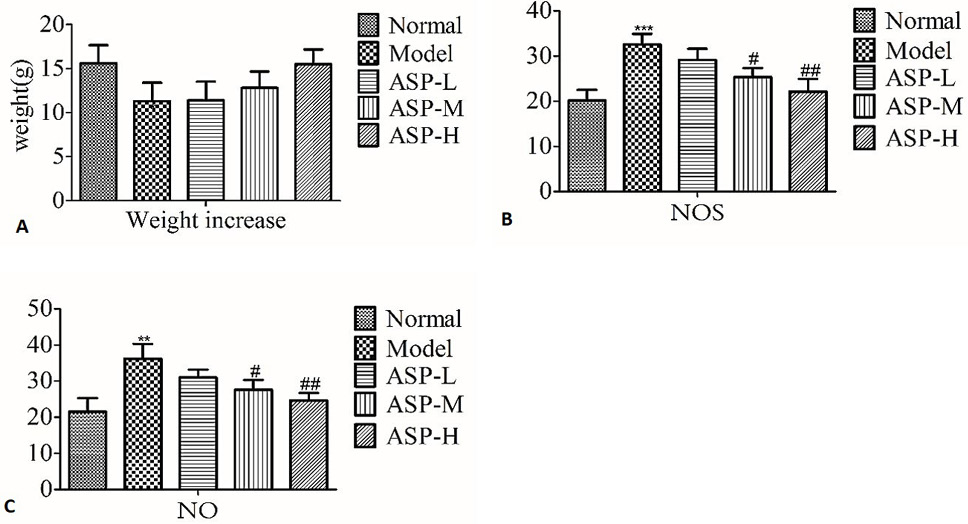
Fig. 1.
Body weight changes of ASP on SD rats and effects of ASP on NOS and NO levels in serum. Values are expressed as means ± SEM. Notes: Compared with normal group: **p < 0.01, ***p < 0.001; compared with model group: #p < 0.05, ##p < 0.01.