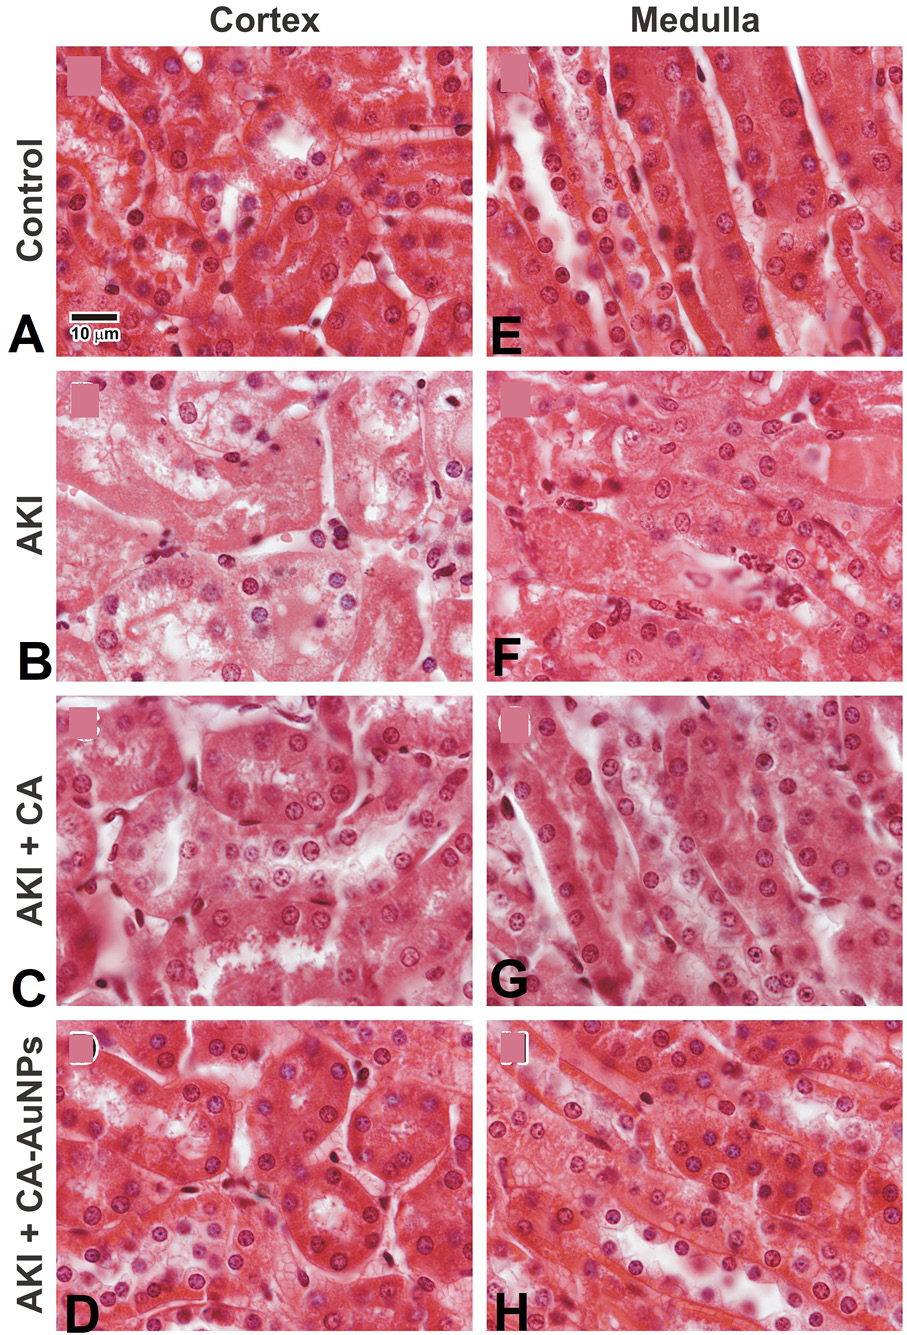
Fig. 2.
H and E stained microscopic images demonstrating kidney cortex and medulla. Images A and E are showing normal kidney architectures. Images B and F are of glycerol treated AKI sections showing damaged proximal tubules and cast deposition in tubules. Images C and g are CA treated group presenting notable decline in tubular cast deposition and damage. While images D and H are CA-AuNPs treated kidney sections displaying more or less complete protection. (Magnification; 600x).