Fig. 1.
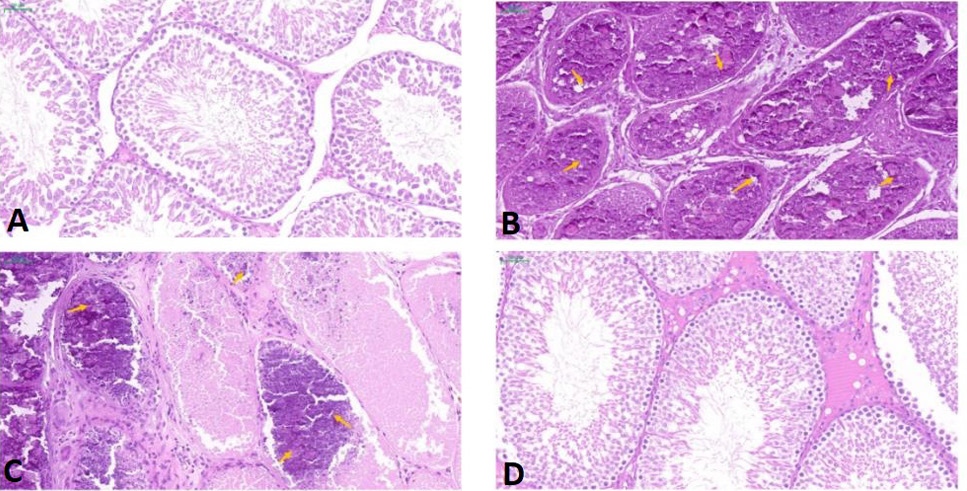
Histopathology of testicular sections from different groups (20×). Scale bar is 50 μm. (A) Control group; (B) CdCl2 group; (C) CdCl2 + Que group; (D) Que group. The orange arrow indicates the germinal epithelium and varicocele.
Histopathology of testicular sections from different groups (20×). Scale bar is 50 μm. (A) Control group; (B) CdCl2 group; (C) CdCl2 + Que group; (D) Que group. The orange arrow indicates the germinal epithelium and varicocele.