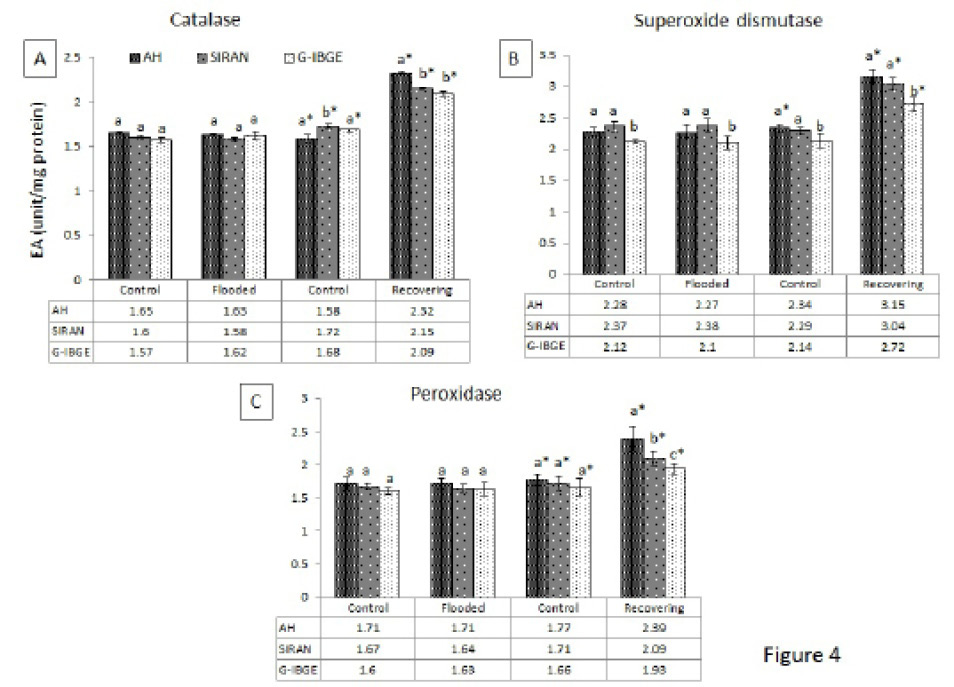
Figure 4:
CAT, SOD and POD activities changes in in wheat varieties under flooding stress and during recovery. The data represents mean of three replicates. EA is abbreviation for enzyme activity. Asterisks (*) represents significance at the level of p<0.05 when compared cultivar over time and cultivar over treatment through One-Way-ANOVA. Different alphabets depict LSD among the cultivars at a specific time-point.