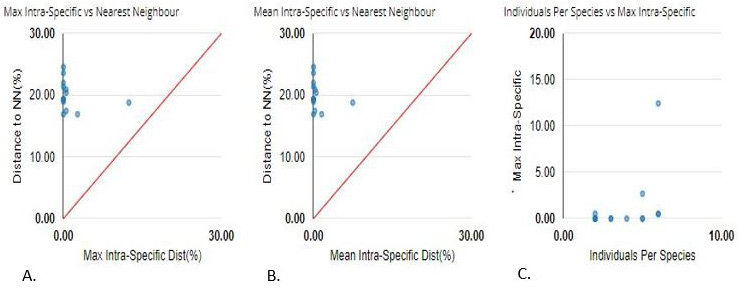
Figure 2:
Barcode Gap analysis. (A) Max Intraspecific vs. Nearest Neighbors: Compares the maximum intraspecific distance of each species to the genetic distance of its nearest neighboring species. (B) Mean Intraspecific vs. Nearest Neighbors: Shows the average intraspecific genetic distance compared to the distance to the nearest neighboring species. (C) Individual per Species: Displays individual genetic distances for each species, highlighting variation within and between species.