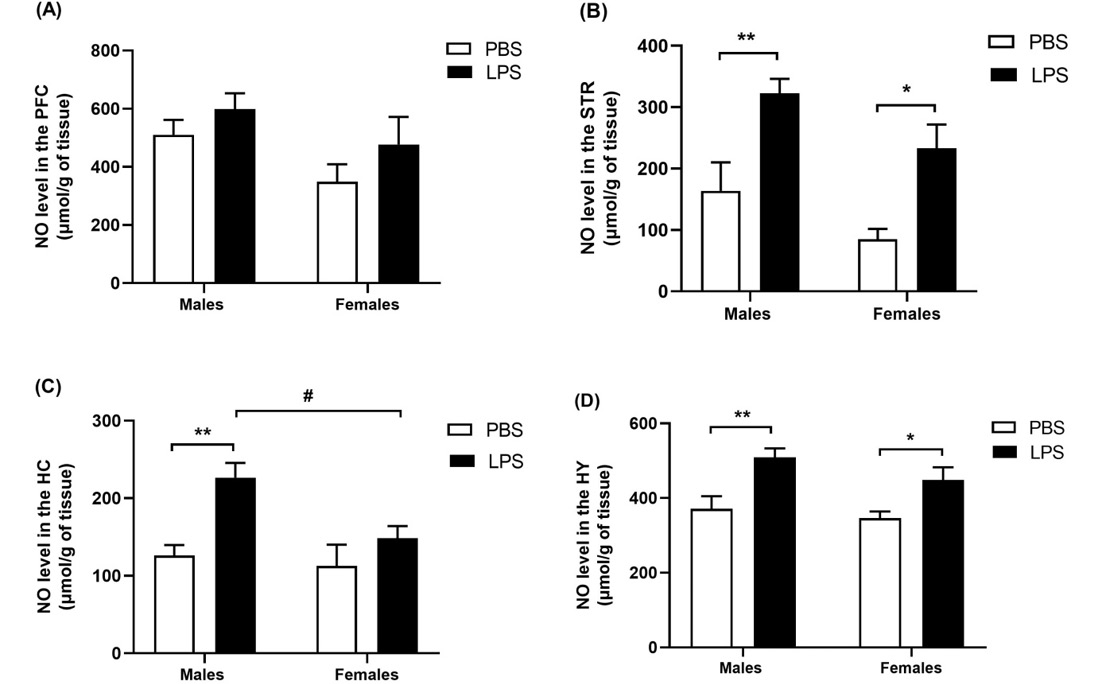
Figure 9:
Concentrations of nitric oxide (NO) in different regions of male and female rat brain. A) NO level in the prefrontal cortex (PFC). B) NO level in the hippocampus (HC) .C) NO level in the striatum (STR). NO level in the hypothalamus (HY). The data are presented as means ± SEM. *p < 0.05 vs. PBS group; and #p < 0.05 vs. gender counterpart.