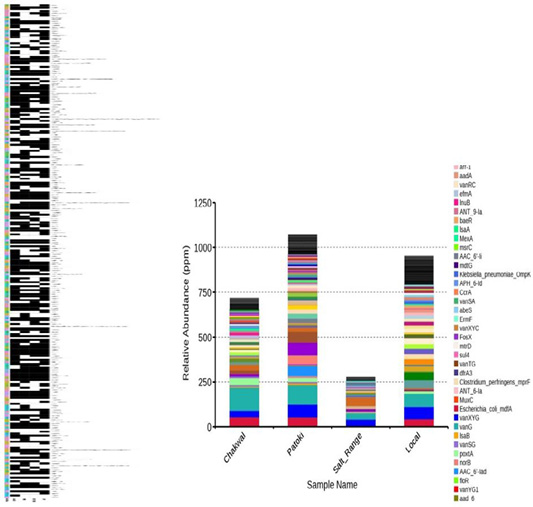
Figure 3:
(A) Prevalence of ARGs. The presence of a specific ARG is represented by black box corresponding to each of the samples, while the white boxes for each sample indicate the absence of corresponding ARGs. (B) The Relative abundance of ARG. The distribution of ARGs within the samples.