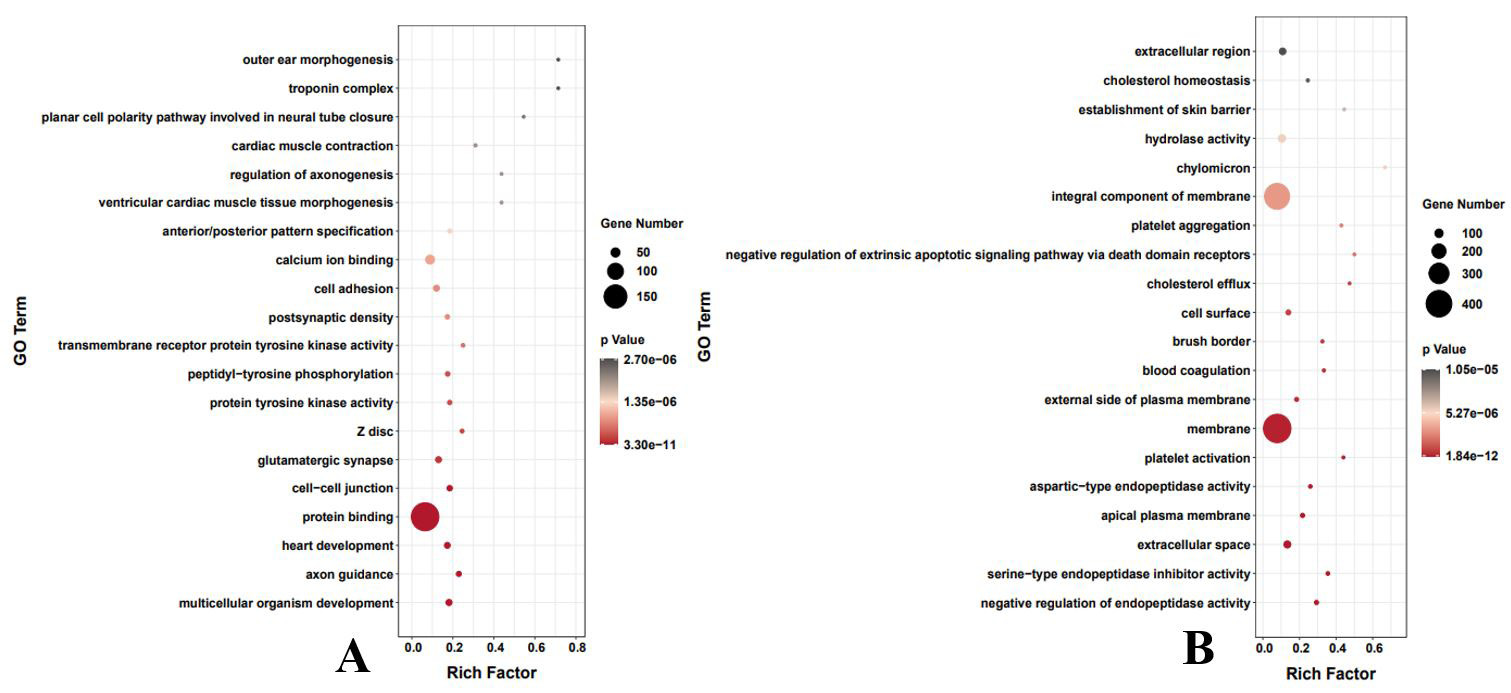
Fig. 3.
Top 20 GO terms of H(E16) (A); U(E16) (B). The horizontal coordinate Rich Factor represents the number of differential genes in the GO/total number of genes in the GO; A larger Rich factor indicates a higher degree of GO enrichment. The vertical coordinate is GO term, i.e., GO functional annotation. In the scatter plot, the size of the dots represents the number of differential genes, and the color of the dots represents the P-value of the enrichment analysis, i.e., the significance of the enrichment, with a P-value smaller than or equal to 0.05 indicating significant enrichment. The GO enrichment analysis scatter plot is based on the significance (P-value) of the enrichment of the top 20 GO terms.