View larger version:
Download Original File
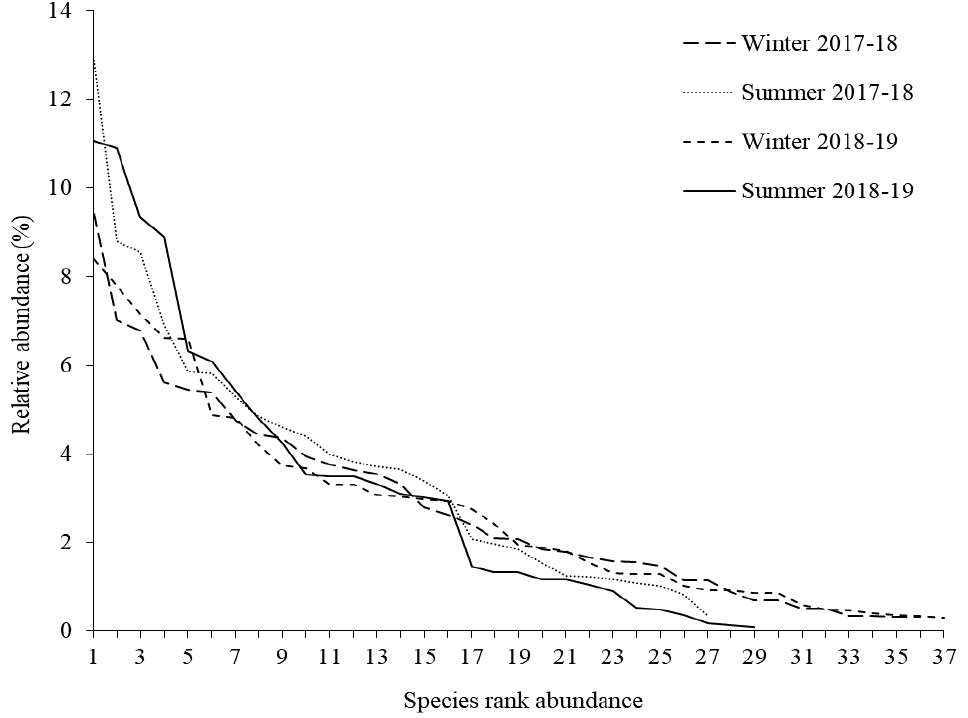
Fig. 2.
Whittaker plot (rank abundance) of seasonal species’ relative abundances.