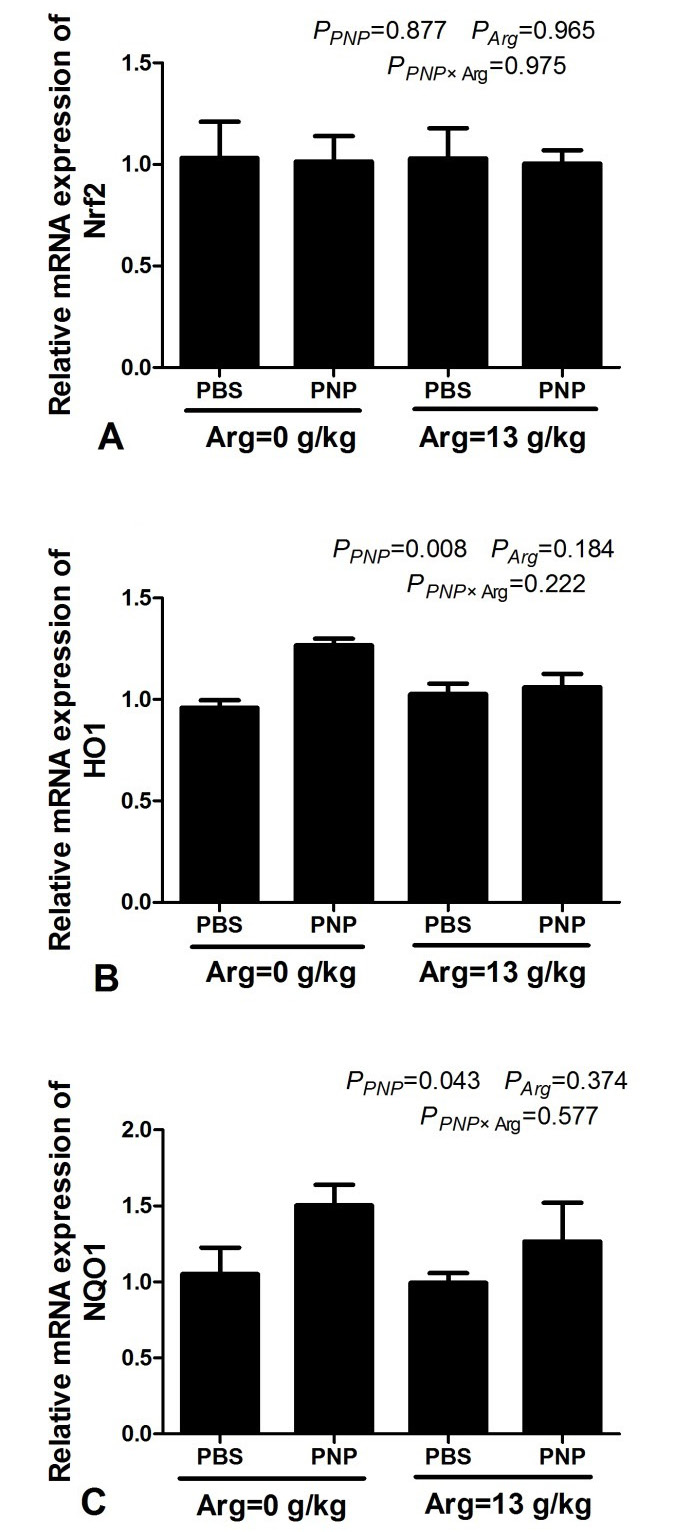
Fig. 4.
Effects of PNP and Arg exposure on the expression of Nrf2 and regulated genes in the liver. (A) Nrf2 mRNA (B) HO-1 mRNA (C) NQO1 mRNA. All data were represented as the mean ± SEM from 6 rats per group. For statistical details see Fig. 2.
