
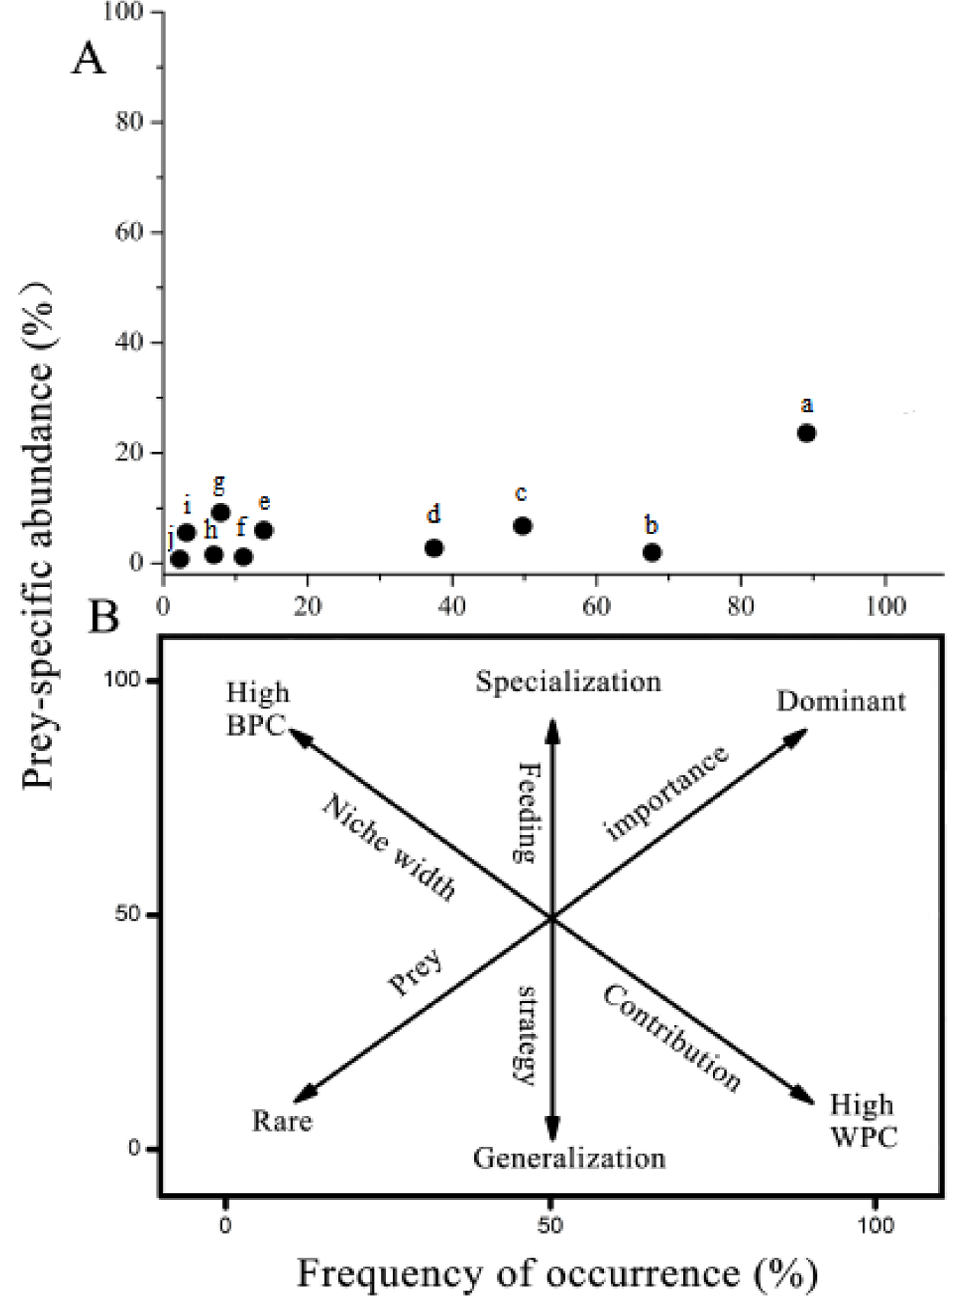
Fig. 5.
Feeding strategy of Saurogobio dabryi (A) Amundsen graph, black dot (•) represents prey category. a: Other; b: Bacillariophyta; c: Cyanophtya; d: Chlorophyta; e: Aquatic insect; f: Oligochaeta; g: Polychaeta; h: Rotaria; i: Crustacea; j: Sarcodina; (B) Explanatory diagram for the interpretation of feeding strategy and prey importance; BPC and WPC represent between-phenotype component and within-phenotype component, respectively.