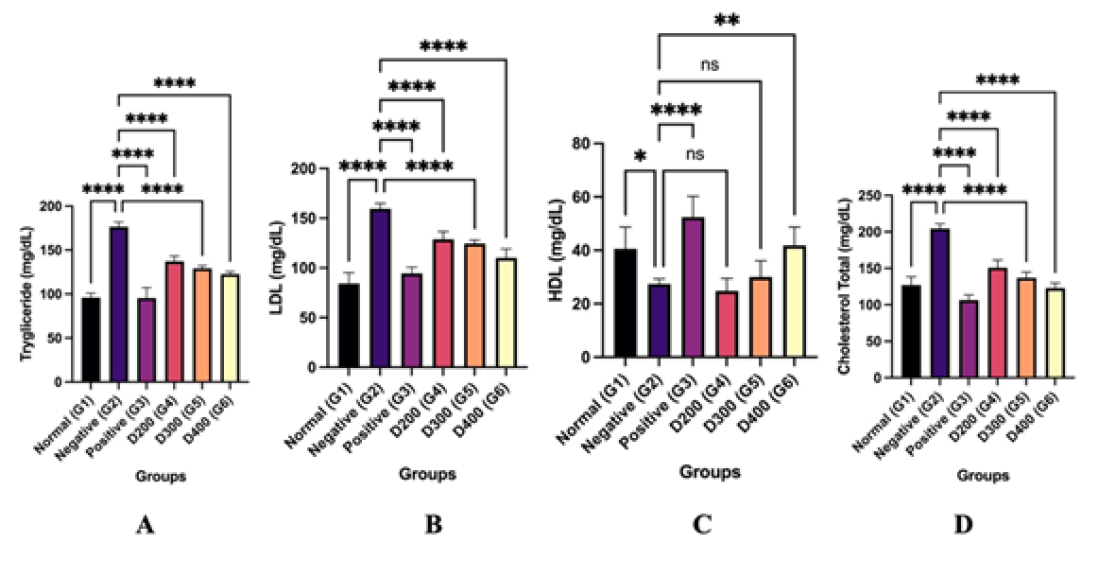
Figure 1.
Lipid Profile Concetration. A. Triglyceride, B. LDL, C. HDL, D. Cholestrol Total. Asterisk *P ≤ 0.05, **P ≤ 0.01, *** P ≤ 0.001, ****P ≤ 0.0001 represents significant differences to negative control group and NS represents not significant (P > 0.05).