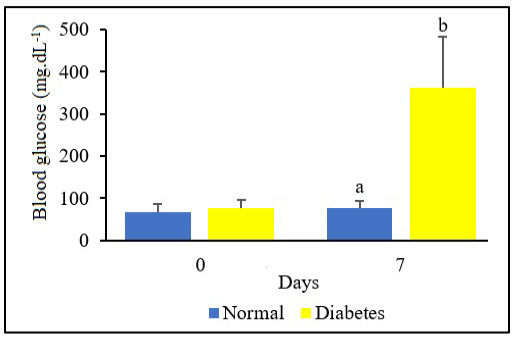
Figure 1:
Bar chart to show the average fasting blood glucose of mice for each treatment on day-0 and day-7 after STZ injection. The difference in letters indicates a significant difference between the treatment groups (α = 5%).
Bar chart to show the average fasting blood glucose of mice for each treatment on day-0 and day-7 after STZ injection. The difference in letters indicates a significant difference between the treatment groups (α = 5%).