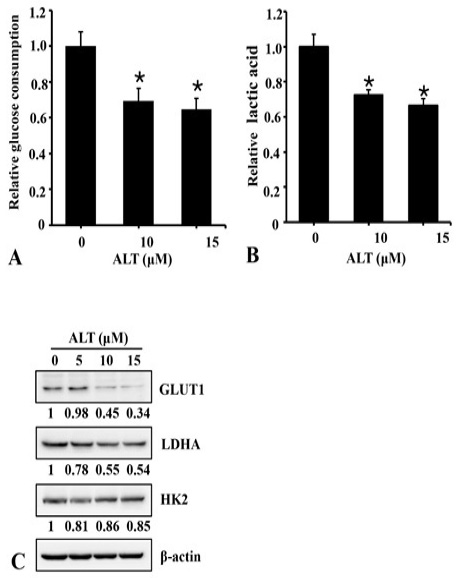
Fig. 3.
Effect of ALT on glucose and lactate level. A2780 cells were cultured and treated with ALT in 6 well plates for 24h. The culture media was collected and level of glucose (A) and lactate (B) was measured using commercially available kits. (C). A2780 cells were treated with ALT in a dose-dependent fashion for 24 h and expression of GLUT1, LDHA, HK2 and B-actin was measured from total cell lysate using Western blot. The numerical values below the immunoblots show the relative density of the band normalized to Beta actin from 3 repeated experiments.
