
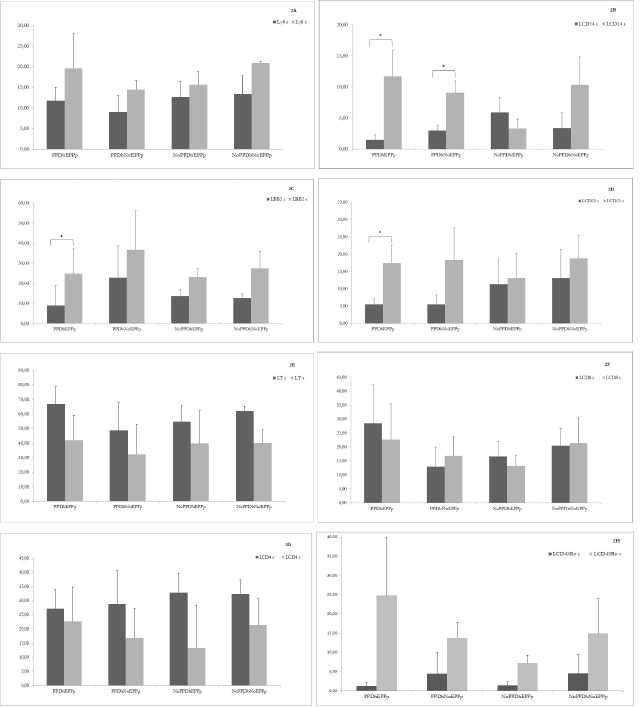
Figure 2:
Resting (r) and stimulated (s) leukocytes subsets before and after PPDb stimuli. Resting (r) and stimulated (s) LTγδ (Graphic 2A), CD14 leukocytes (Graphic 2B), B B2 (Graphic 2C), CD25 activation marker (Graphic 2D), LT (Graphic 2E), LTCD8 (Graphic 2F), LTCD4 (Graphic 2G) and CD45Ro (Graphic 2H) are shown in mean percentages with standard deviation bars. Resting and stimulated leukocytes subsets were set with FACS before and after PPDb stimuli (20 µg/mL), respectively. Values were compared with multiple paired t test and significance was signaled with * when p<0.05