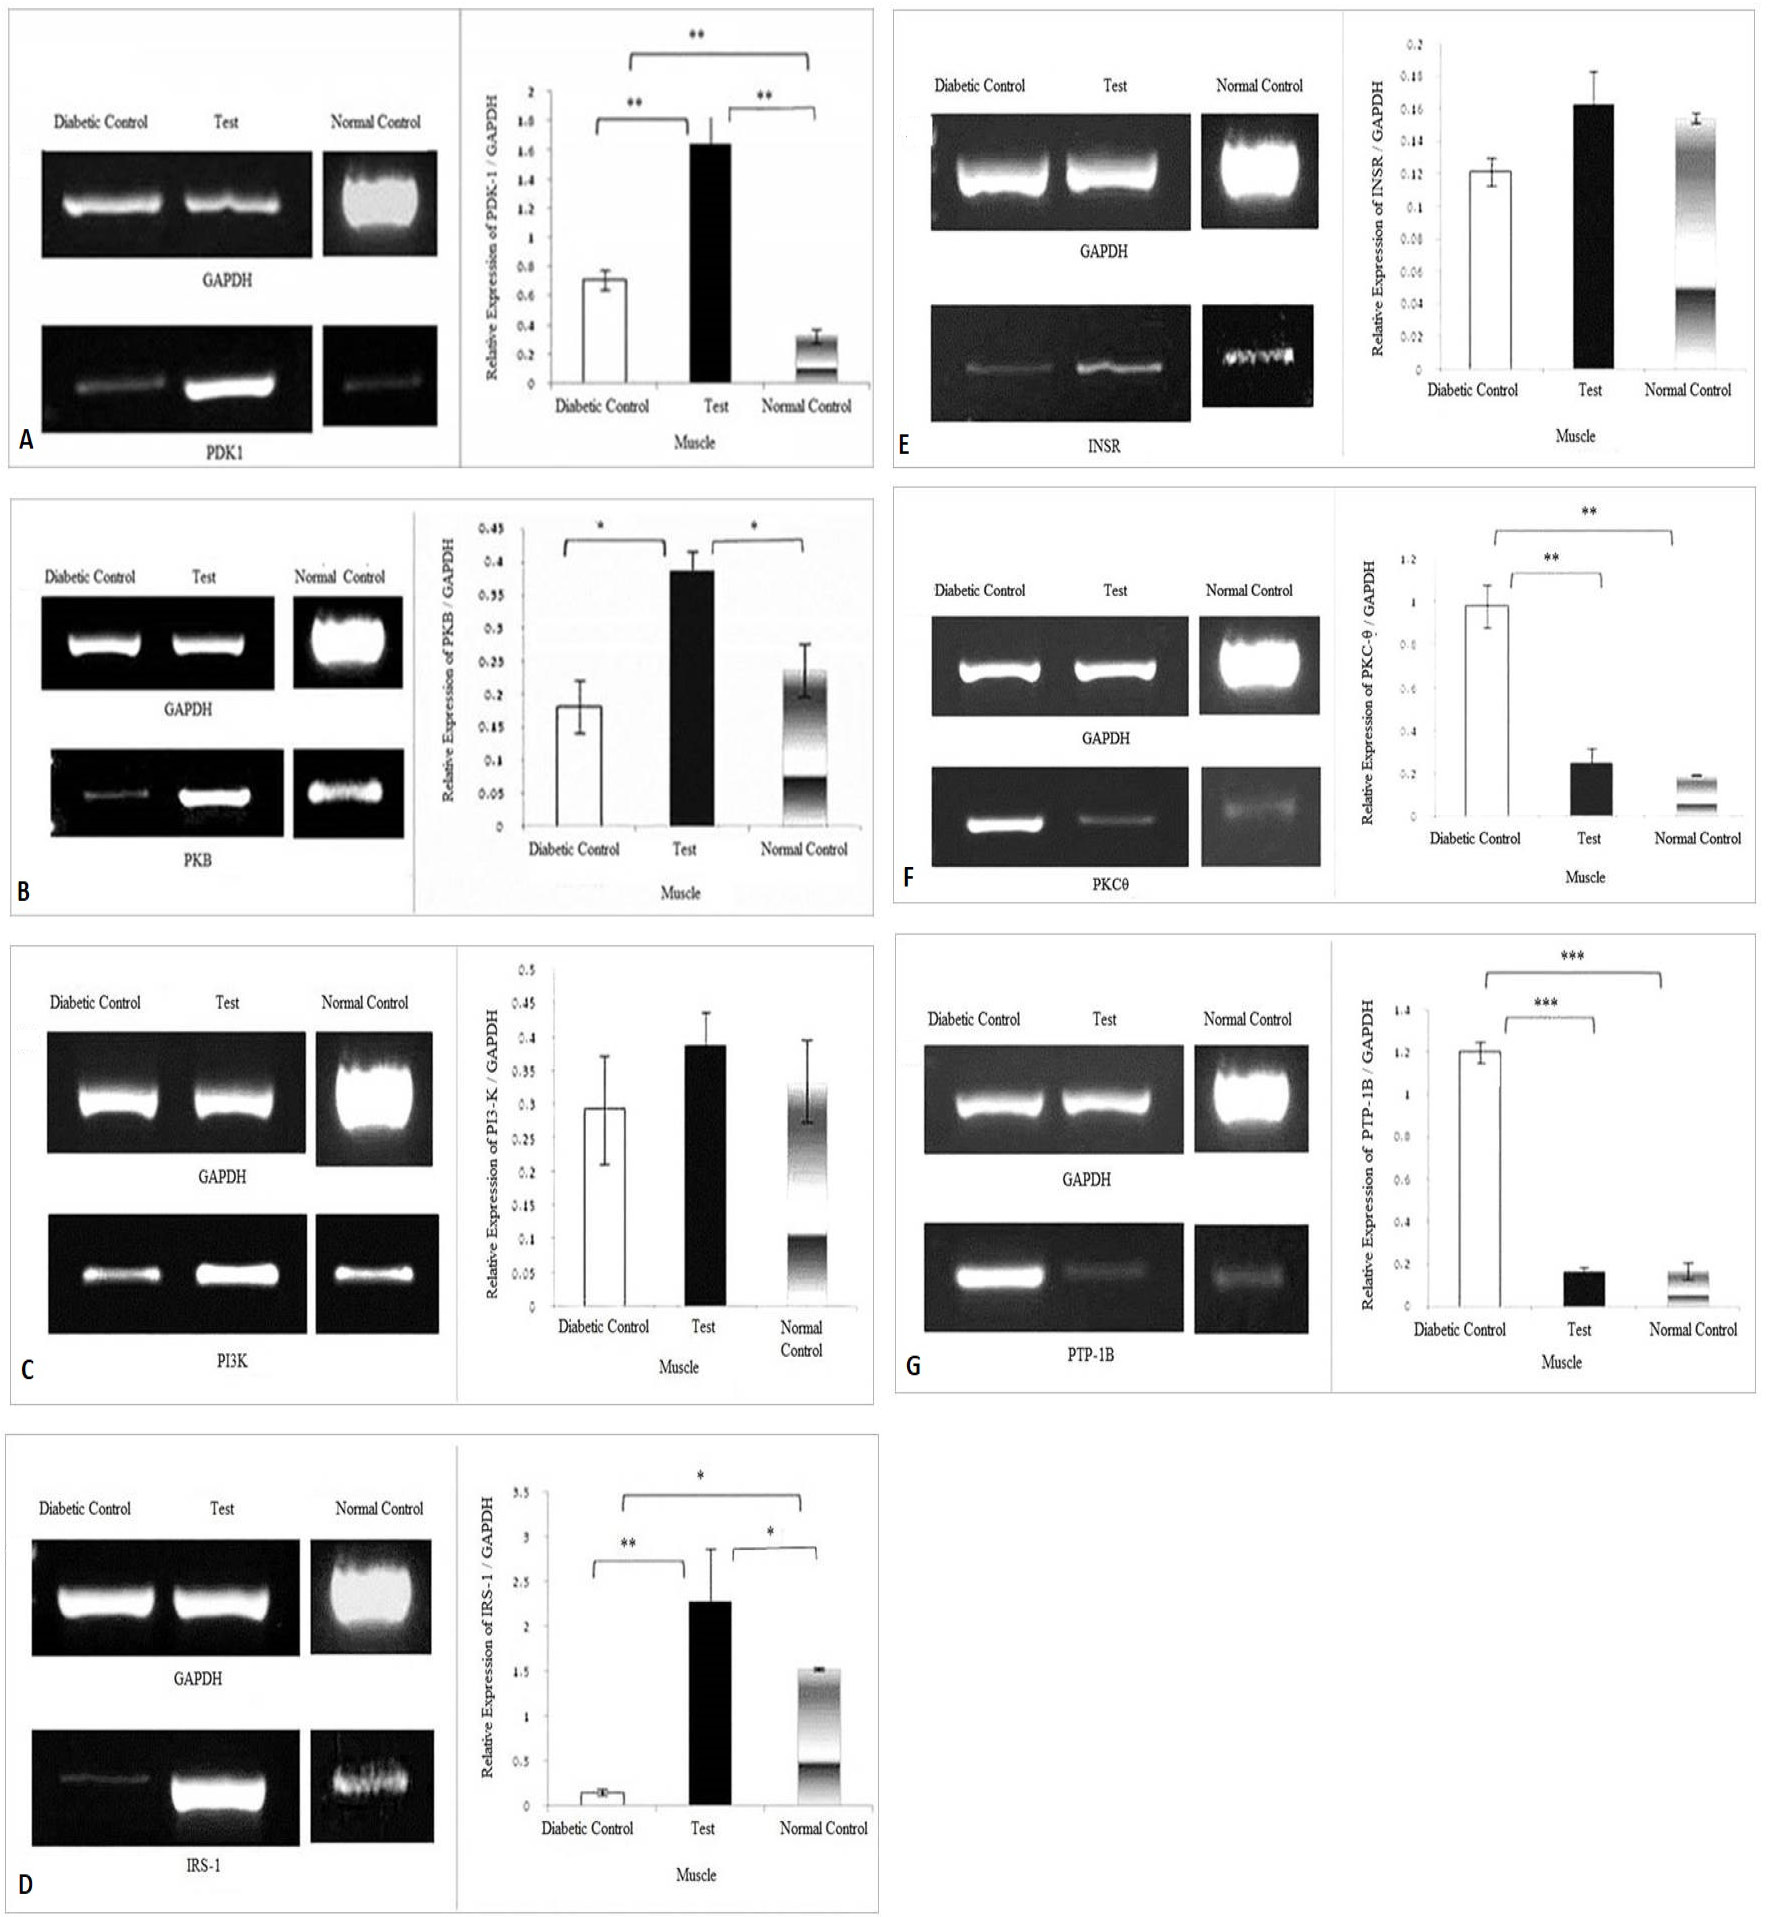
Fig. 3.
Effect of herbal combination extract on the expression levels of (A) PDK-1, (B) PKB, (C) PI3-K, (D) IRS-1, (E) INSR, (F) PKC-θ, (G) PTP-1B, genes in the skeletal muscle. The density of each band was measured as Integrated Density Values (IDVs). The graphs are showing expression of genes relative to the expression of GAPDH. Analysis was done by one way ANOVA followed by Bonferroni’s post hoc test for comparison between groups using Sigma plot software. Data are presented as means ± SD and level of significance is p < 0.05 (where * = p < 0.05; ** = p < 0.01 and *** = p < 0.001; n = 6).
