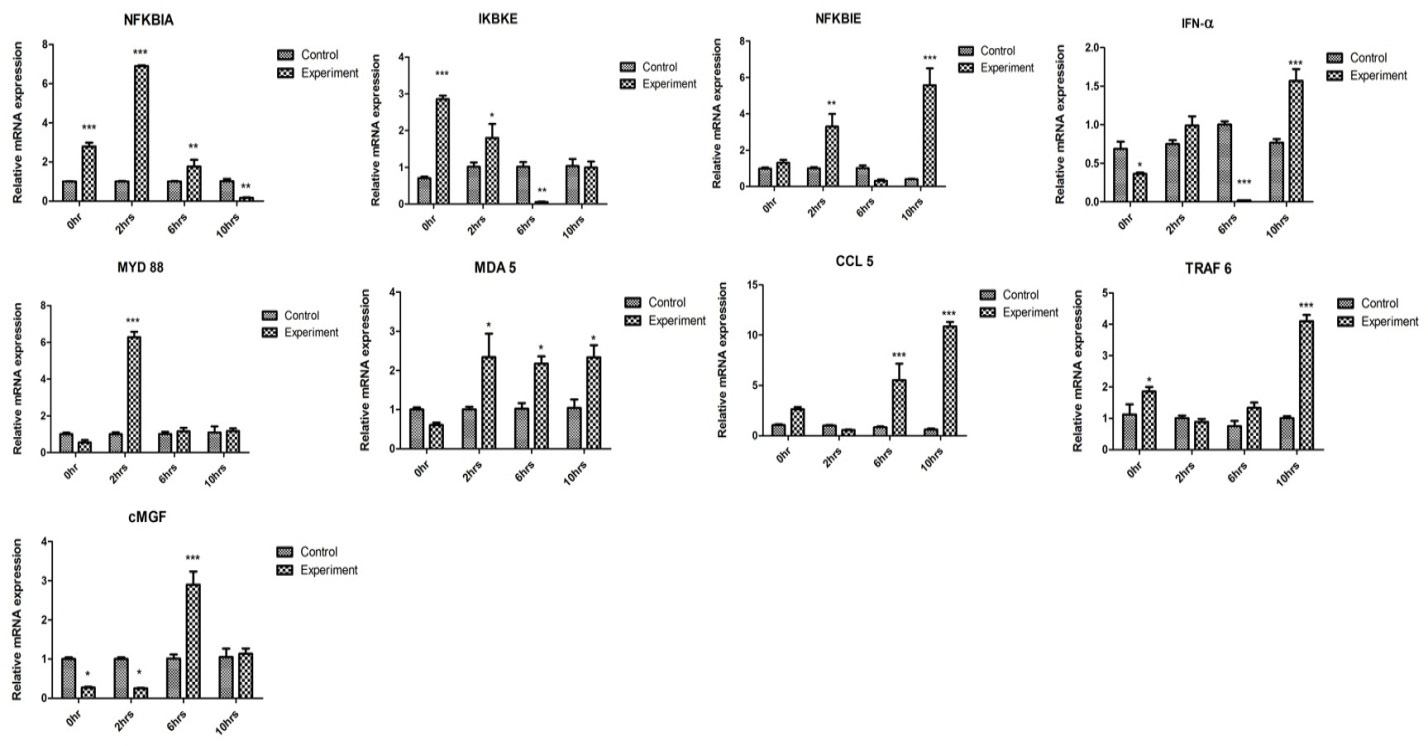
Fig. 2.
The expression pattern of NF-κB signaling pathway and other immune system genes in chicken erythrocytes on 0 h, 2 h, 6 h, 10 h post-infection (Hpi).. This experimental study group was as follows: The control group (Con, erythrocytes treated with PBS, n = 3) and the Experiment group (Exp, erythrocytes infected with M. synoviae, n = 3). Expression levels of NF-κB signaling pathway and other immune system genes were relatively calculated to that of 18S rRNA the housekeeping genes via quantitative real-time PCR. SEM (standard error of mean) represented by error bars. Bars with asterisks indicate a significant (*P < 0.05, **P < 0.01, ***P ≤ 0.001) Up or Downregulated relative mRNA expression when compared to uninfected control group.