
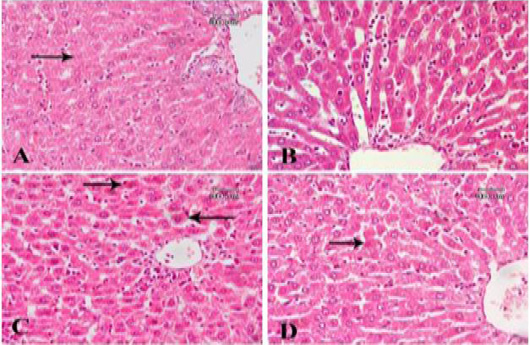
Figure 6:
A photomicrograph of sections from liver tissue: (A) section of rat treated with bisphenol and then Fagonia cretica (low dose) shows mild fibrosis around main blood vessels. Some hepatocytes show karryolysis (arrow). (B) Another section for the same group shows mild dilatation and congestion of blood sinusoids. (C) A section of rat treated with bisphenol and then Fagonia cretica (medium dose) shows slight cellular infiltration. Some hepatocytes show acidophilic color (arrow). (D) A section of rat treated with bisphenol and then Fagonia cretica (high dose) shows marked amelioration of liver tissue, only a few acidophilic hepatocytes are observed (arrow).