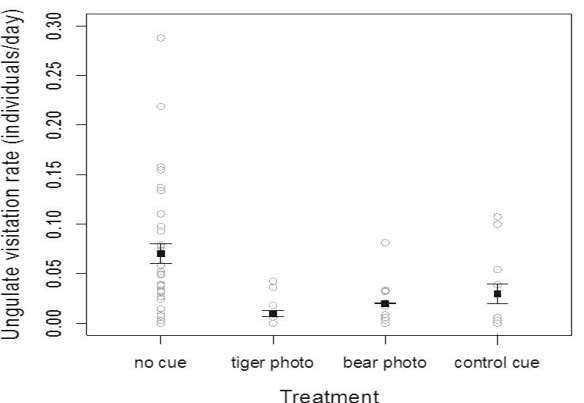
Fig. 3.
Ungulate visitation rates (individuals/day) at camera trap sites under four different treatments: no cue, predator photo cues (amur tiger/brown bear), and a control cue. Treatment significantly predicted ungulate visitation rate (X23 = 18.53, P <0.001; Table I). Visitation to sites with the tiger cue and the bear cue differed significantly from visitation to sites where no cue was present (tiger photo Z = -4.51, P < 0.0001; bear photo Z = -2.97, P = 0.015, respectively). Visitation to no cue and control cue sites did not differ (Z = -1.65, P = 0.35). Visitation responses to tiger and bear cues were not statistically different (Z = -1.46, P = 0.46).