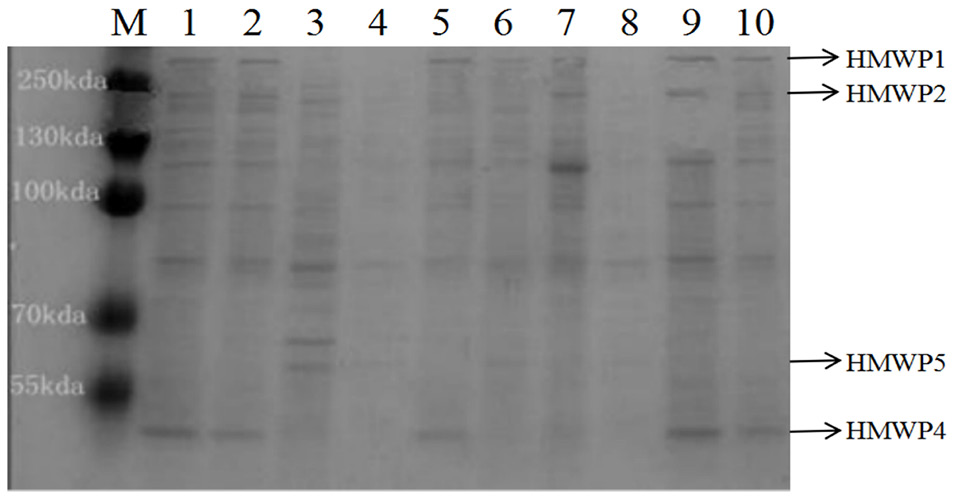
Fig. 5.
The expression profile of HMWPs under iron starvation (M: Protein marker; 1, Positive strain; 2-10, The experimental strains. HMWPs bands, irp1-348kDa, irp2-229kDa, irp4-29kDa, irp5-57kDa; irp3 was the basic protein (pH 8.8) so did not detect protein bands).